Figures & data
Table 1. Summary of calls assigned to civilian responders by early adopter call diversion programs.
Table 2. Definitions of BPD call dispositions.
Table 3. Distribution of call dispositions.
Table 4. Monte Carlo simulation model inputs and assumptions for early adopter design scenario.
Figure 1. Volume of 911 calls diverted to civilian first responders based on alternate design scenarios, FY2015-20.
Table 5. Twenty-five most frequent categories of BPD calls for service, FY2015-20.
Figure 2. Outcome probabilities of emergency calls assigned to Baltimore police by category, FY2015-20.
Notes: Gray circle size represents the volume of calls by incident type; shaded areas represent regions that include retasked calls under restrictive (darker shading) and permissive (lighter shading) designs. The axes are displayed in a logarithmic scale to differentiate low probability incidents. The data used to create this figure are reported in Table A2 of the Technical Appendix.
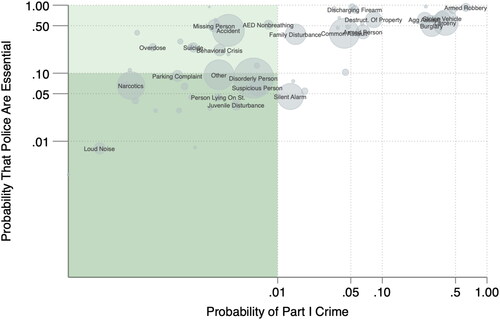
Figure 3. Histograms of early adopter design scenario estimates of BPD time diverted, civilian re-tasking cost, and the net budgetary impact on the city of Baltimore based on Monte Carlo simulations.
Notes: Vertical dotted lines represent, from left to right, the lower bound of the 95% confidence interval, the median prediction, and the upper bound of the 95 percent confidence interval. The vertical red line is the mean prediction.
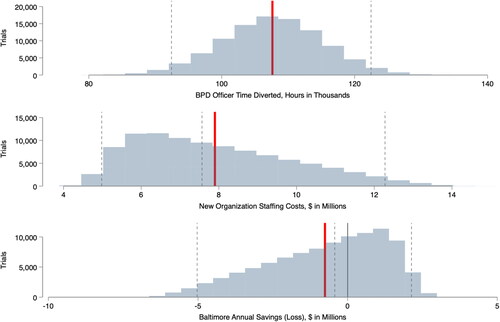
Table 6. Monte Carlo simulation estimates for early adopter design scenario.
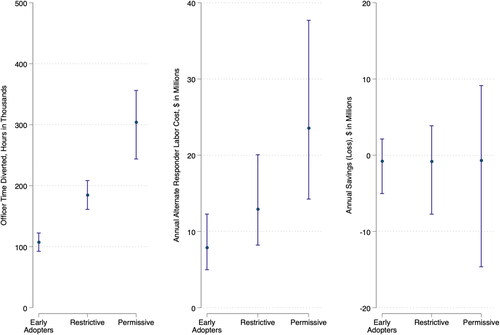
Figure 4. Monte Carlo estimates for alternate design scenarios.
Notes: Dots correspond to mean estimate generated for each scenario by the Monte Carlo model; lines reflect 95 percent confidence intervals around the mean estimate.