Figures & data
Table 1. General participant characteristics per season and time of day.
Table 2. Spectrally-weighted α-opic lx levels at the eye level for each lighting condition based on calculations of Lucas et al. (Citation2014).
Figure 1. Overview of the experimental design. Note. SI stands for Subjective Indicators.
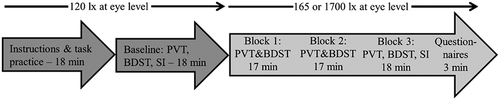
Table 3. Values of possible confounding variables: characteristics measured at the session level.
Table 4. Baseline scores of the outcome variables for the autumn/winter and the spring sample.
Table 5. Baseline scores for the autumn/winter and the spring sample, in the morning and afternoon, for both lighting conditions.
Figure 2. Effects of illuminance level on average speed during PVT performance and percentage correct during BDST easy and difficult trial performance in the morning and afternoon sessions, in spring versus autumn/winter. Performance values during the light exposure are displayed as EMM’s and error bars as SE’s resulting from the LMM post hoc analyses. These values are corrected for corresponding baseline values. †p < 0.1; *p < 0.05; **p < 0.01; ***p < 0.001..
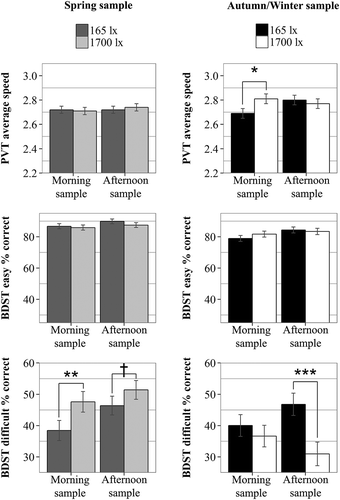
Figure 3. Effects of illuminance level on HR during PVT and BDST performance in the morning and afternoon sessions, in spring versus autumn/winter. Average HR values (beats per minute) during the light exposure are displayed as EMM’s and error bars as SE’s resulting from the LMM post hoc analysis. These values are corrected for corresponding baseline values. †p < 0.1; *p < 0.05.
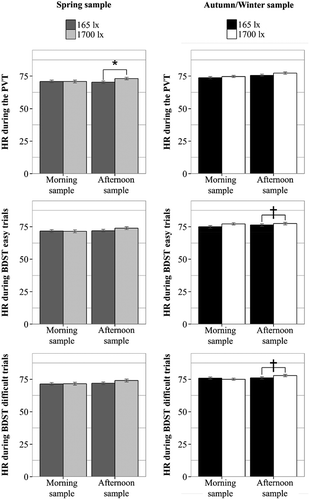
Figure 4. Effects of illuminance level on SCL during PVT and BDST performance in the morning and afternoon sessions, in spring versus autumn/winter. Average SCL values (µSiemens) during the light exposure are displayed as EMM’s and error bars as SE’s resulting from the LMM post hoc analysis. These values are corrected for corresponding baseline values. †p < 0.1.
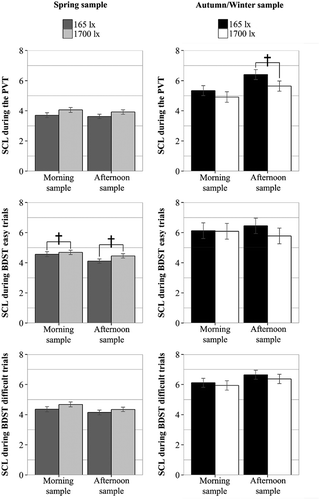
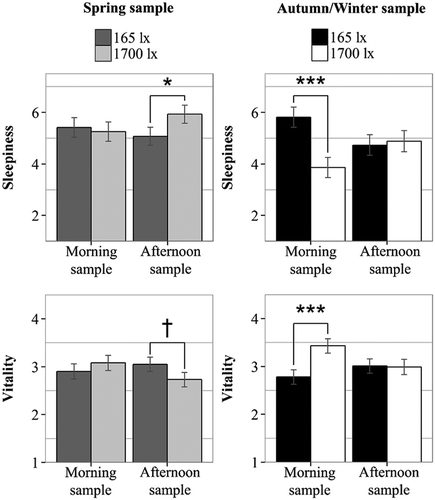
Figure 5. Effects of illuminance level on feelings of sleepiness and vitality during the morning and afternoon sessions in spring versus autumn/winter. Average sleepiness and vitality values during the light exposure are displayed as EMM’s and error bars as SE’s resulting from the LMM post hoc analyses. These values are corrected for corresponding baseline values. †p < 0.1; *p < 0.05; ***p < 0.001. Note. When sleepiness values in spring were compared between 165 lx versus 1700 lx, instead of 165 lx versus 600 lx versus 1700 lx, a significant effect of Light on sleepiness appeared in the afternoon, which showed increased sleepiness after 1h of 1700 lx exposure compared to 165 lx. This difference did not reach statistical significance during the spring study reported in Huiberts et al. (Citation2016) when three light conditions were compared and Bonferroni adjusted for multiple comparisons.