
Figures & data
Table 1. Participants’ characteristics median age was calculated using all nights.
Figure 1. Flowchart of inclusion and exclusion criteria of participants and daily sleep data. The difference indicates the number of nights excluded at each step.
Figure 2. The distribution of participant-nights shown in percentages according to gender and age decade used for analysis. Black bars, males; gray bars, females.
Table 2. Date of maximum, minimum points of each parameter. Maximum and minimum dates were calculated using linear mixed-effects regression in summer and winter.
Figure 3. Weekly changes of the averages of the sleep parameters for all participants (adjusted for sex and age; open circles), temperature (red line, upside down), and sunrise time (blue line). Upper panels: All day averages. Lower panels: Weekday average (open circles) and weekend average (filled circles). Dotted line indicates smoothed data with spline interpolation. One plotted dot corresponds to more than 500 participant-nights. (a) Sleep onset time, (b) sleep offset time, (c) mid-sleep (MS), (d) wakefulness after sleep onset (WASO), (e) sleep efficiency (SE).
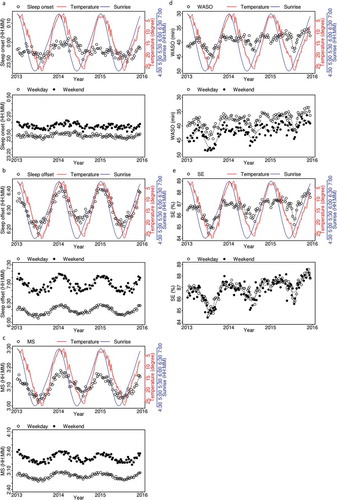
Figure 4. Correlation of the averaged sleep parameters adjusted age and sex, (a) sleep onset time, (b) sleep offset time, (c) MS, (d) WASO, and (e) SE compared with sunrise time every 5 min (left panels) and temperature (right panels). All day (open circles), weekday (open triangles), and weekend (crosses). Averaged data are plotted. Dotted lines indicate smoothed data with spline interpolation. One plotted dot corresponds to more than 500 participant-nights.
Figure 5. Correlation of the average of sleep offset time adjusted by age and sex with sunrise time every 5 min (corresponds to ), right panel). All day (open circles), weekday (open triangles), and weekend (crosses). Average data are plotted. The data are also divided into two periods (Dec, winter solstice to Jun, summer solstice; blue, and Jun, summer solstice to Dec, winter solstice; red). Dotted lines indicate smoothed data with spline interpolation. One plotted dot corresponds to more than 250 participant-nights.
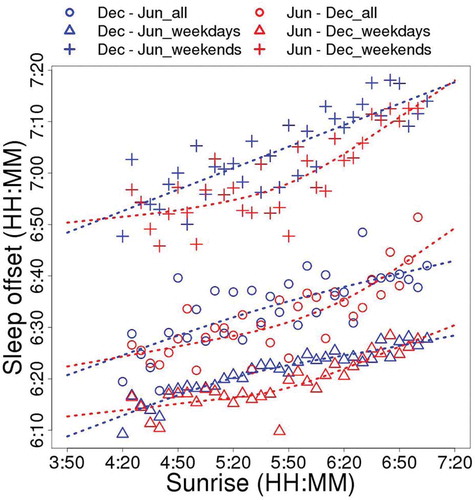
Table 3. Comparison of each sleep parameters in monthly data. Mean, median, and standard deviation of p-value were calculated using 1000 times repeated multiple comparison tests with Bonferroni correction result. Data were adjusted for age, sex, and type of day.