Publication Cover
Chronobiology International
The Journal of Biological and Medical Rhythm Research
Volume 36, 2019 - Issue 11
1,155
Views
4
CrossRef citations to date
0
Altmetric
Short Communication

Does the circadian clock make RPE-mediated ion transport “tick” via SLC12A2 (NKCC1)?

ORCID Icon, , , &
Pages 1592-1598 | Received 06 May 2019, Accepted 05 Aug 2019, Published online: 23 Aug 2019

Figures & data

Figure 1. The circadian clock likely regulates ion transport by the ARPE-19 monolayers via NKCC1. a. Both ARPE-19 monolayers (ARPE-19M) and dispersed cell cultures (ARPE-19CC) expressed SLC12A2 mRNA. Amplification products were confirmed by sequencing. b. Confocal microscopy revealed that NKCC1 localized on the apical membrane of ARPE-19 monolayers (white arrows). c. The mRNA expression of SLC12A2 was rhythmic in ARPE-19 monolayers as determined by RT-PCR analysis. d. In RPE monolayers, two-way ANOVA revealed that apical supernatants had higher Na+, K+ and Cl concentrations than basolateral supernatants. Time significantly affected K+ concentrations and tended to affect Na+. e. Spearman’s correlation analysis of the expression of SLC12A2 mRNA and the calculated inter-compartmental ion concentration gradients or fluid difference (Api – BL). Values are plotted c, e. or represented as means ± SEM d. n = 3.

Figure 1. The circadian clock likely regulates ion transport by the ARPE-19 monolayers via NKCC1. a. Both ARPE-19 monolayers (ARPE-19M) and dispersed cell cultures (ARPE-19CC) expressed SLC12A2 mRNA. Amplification products were confirmed by sequencing. b. Confocal microscopy revealed that NKCC1 localized on the apical membrane of ARPE-19 monolayers (white arrows). c. The mRNA expression of SLC12A2 was rhythmic in ARPE-19 monolayers as determined by RT-PCR analysis. d. In RPE monolayers, two-way ANOVA revealed that apical supernatants had higher Na+, K+ and Cl− concentrations than basolateral supernatants. Time significantly affected K+ concentrations and tended to affect Na+. e. Spearman’s correlation analysis of the expression of SLC12A2 mRNA and the calculated inter-compartmental ion concentration gradients or fluid difference (Api – BL). Values are plotted c, e. or represented as means ± SEM d. n = 3.

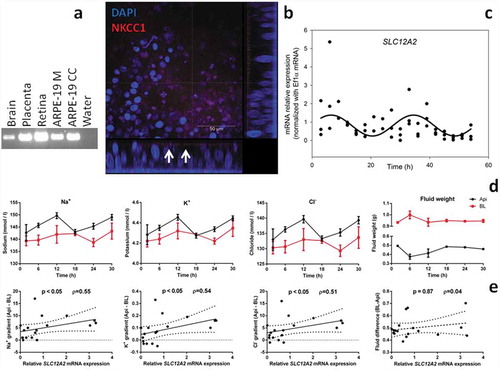
Table 1. Statistical analysis of rhythmicity in ARPE-19 supernatant components. Units for ion amplitudes are in mmol/l, for fluid amplitudes in ml. Data were fitted to the equation y = y0 + ccos[2π(t-ϕ)/τ] by non-linear regression. Bold values represent p < .05.

Supplemental material

Supplemental Material

Download MS Excel (13 KB)