Figures & data
Table 1. Contribution of exogenous environmental 24 h cycles and innate circadian rhythms to the typical 24 h BP pattern of most normotensive and uncomplicated hypertensive persons
Table 2. Recommended guidelines for the design and conduct of prospective hypertension chronopharmacology and chronotherapy trials
Figure 1. 24 h SBP profile (dashed thick lines) of four male subjects, respectively, dipper (upper left), extreme-dipper (upper right), nondipper (lower left) and riser pattern (lower right), having the same 24 h SBP mean of 124.5 mmHg. The SBP profiles are plotted with respect to circadian time-specified tolerance limits for normal SBP (continuous thin lines), calculated from a reference population of normotensive individuals of comparable rest-activity cycle and male sex
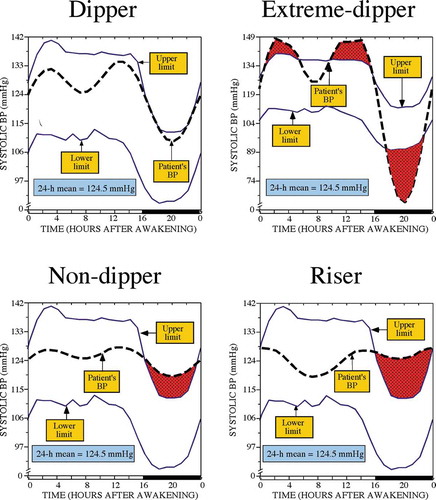
Figure 2. Adjusted HR of CVD events in the Hygia Project cohort entailing 21,963 individuals. Participants were categorized into four nonoverlapping groups according to the level (normal or elevated) of the ABPM-derived awake and asleep SBP/DBP means. The ABPM-derived awake SBP/DBP means were considered normal if <135/85 mmHg and elevated otherwise. The asleep SBP/DBP means were considered normal if <120/70 mmHg and elevated otherwise. Adjustments were applied, if significant, for sex, age, diabetes, CKD and history of previous major CVD event
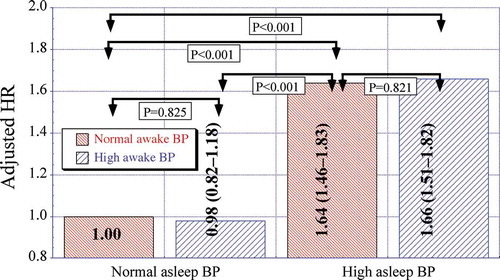
Figure 3. Adjusted HR of CVD events in the Hygia Project cohort entailing 21,963 individuals. Participants were categorized into four nonoverlapping groups according to the level (normal or elevated) of the ABPM-derived asleep SBP/DBP means and extent of the sleep-time relative SBP decline. The ABPM-derived asleep SBP/DBP means were considered normal if <120/70 mmHg and elevated otherwise. Participants were designated as dipper when the sleep-time-relative SBP decline was ≥10% and as nondippers when <10%, using data sampled at 20–30 min intervals by ABPM for 48 consecutive hours. Adjustments were applied, if significant, for sex, age, diabetes, CKD and history of previous major CVD event
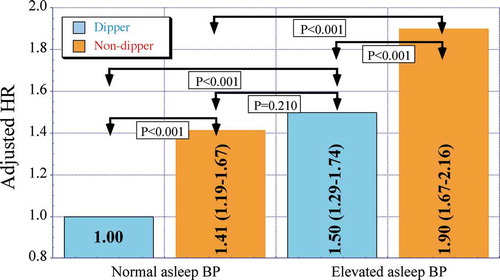
Figure 4. 24 h SBP profile (dashed thick lines) of a normotensive dipper man plotted with respect to circadian time-specified tolerance limits for normal SBP (continuous thin lines) calculated from a reference population of normotensive individuals of comparable rest-activity cycle and male sex. The same ABP data are represented as a function of clock time (left) and biological time, i.e. hours from bedtime (right)
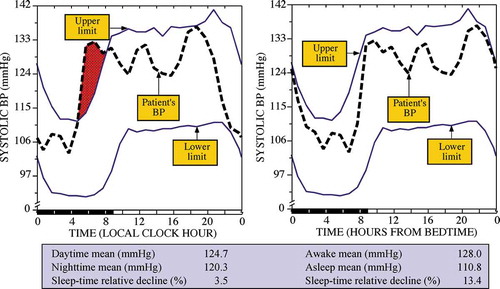
Figure 5. Clock hour distribution of wake-up (left) and bed times (right) at the baseline ABPM evaluation of the MAPEC Study cohort entailing 3,344 individuals
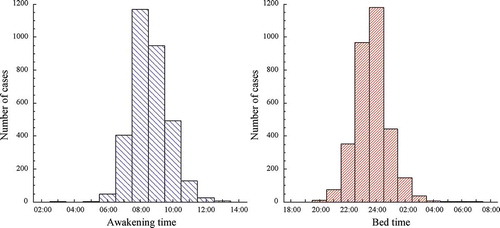
Figure 6. Left: Distribution of duration of sleep determined by wrist actigraphy at the baseline ABPM evaluation of the MAPEC Study cohort entailing 3,344 individuals. Right: Correlation between duration of sleep and age for the same MAPEC Study clinical cohort
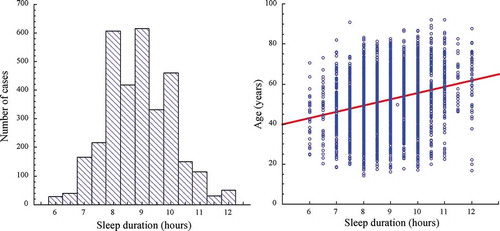
Figure 7. Difference of ~4.4% in the calculated sleep-time relative decline for SBP versus DBP of the same arterial hypertensive individual assessed by around-the-clock ABPM, demonstrating the differential and misleading sleep-time relative decline dipping classification when improperly based on DBP measurements (resulting in conclusion of dipper categorization) rather than when properly based on SBP measurements (resulting in conclusion in nondipper categorization)
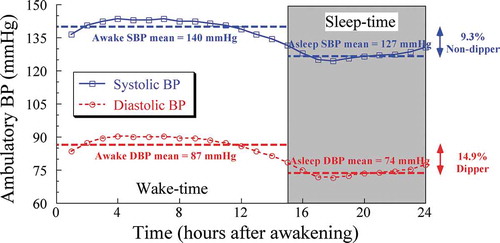
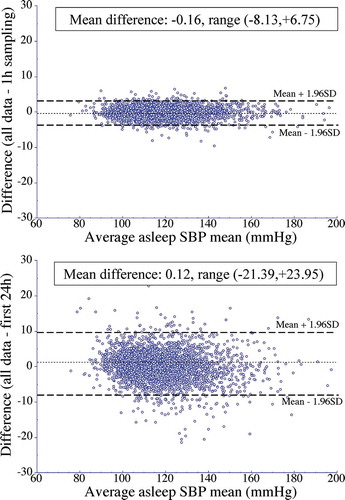
Figure 8. Bland-Altman plots assessing agreement of the asleep SBP mean calculated utilizing the original data sampled by ABPM every 20–30 min for 48 consecutive hours versus that estimated from the (i) modified time series composed of data sampled every 1 h for 48 consecutive hours (top) and (ii) original sampling rate of every 20–30 min for the first 24 h, only (bottom). Dotted horizontal line of each graph represents the average of the differences across the entire studied population. Dashed lines represent the values of the average difference ±1.96SD (assumingly containing 95% of the individual values)