Figures & data
Table 1. Participant characteristics of the control group (CON), type 1 diabetes without DSPN (T1D/-DSPN), and type 1 diabetes with DSPN(T1D/+DSPN). Data are presented as median [Q1, Q3] unless otherwise stated. BMI, body mass index; BPM, beats/min; HbA1c, Hemoglobin A1c; DSPN, distal symmetric polyneuropathy; T1D, type 1 diabetes; CON, control group
Figure 1. Box and whisker plots demonstrating max amplitude (a), mean peak amplitude (b), mean contraction (c), and motility index (d) in the control group (CON) (evening: n = 25, night: n = 28, morning: n = 23), type 1 diabetes without DSPN (T1D/-DSPN) (evening: n = 36, night: n = 36, morning: n = 26), and type 1 diabetes with DSPN (T1D/+DSPN) (evening: n = 30, night: n = 32, morning: n = 30). Purple boxes = CON, teal boxes = T1D/+DSPN, yellow boxes = T1D/-DSPN. Effect of group adjusted for sex and age was assessed by one-way ANOVA at each time-point, and a Tukey post-hoc test was applied to asses between-group differences. Overall effect of group is marked by a line with p-value. DSPN, distal symmetric polyneuropathy; T1D, type 1 diabetes; CON, control group
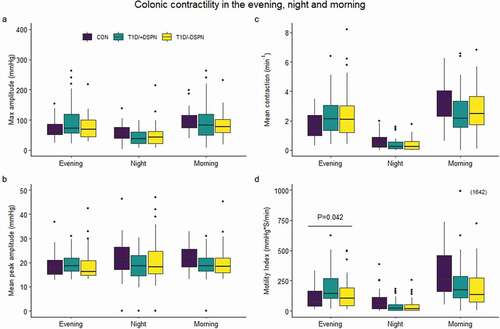
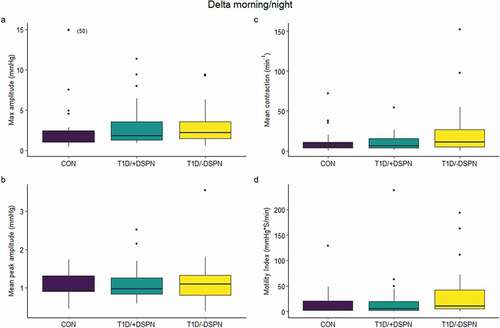
Figure 2. Box and whisker plots demonstrating delta values calculated as morning/night of max amplitude (a), mean peak amplitude (b), mean contraction (c), and motility index (d) in the control group (CON: n = 23), type 1 diabetes without DSPN (T1D/-DSPN: n = 22), and type 1 diabetes with DSPN (T1D/+DSPN: n = 27). Purple boxes = CON, teal boxes = T1D/+DSPN, yellow boxes = T1D/-DSPN. Effect of group adjusted for sex and age was assessed by one-way ANOVA at each time-point. DSPN, distal symmetric polyneuropathy; T1D, type 1 diabetes; CON, control group