Figures & data
Figure 1. Amplitude, R2, and COG of WAT clock gene rhythms in sham- and SCN-lesioned animals. Amplitudes and R2 of clock gene rhythms were reduced by approximately 50% after SCN lesions. COG was advanced by ~4 h after SCN lesions, with the exception of Bmal1 in sWAT. Cry2 and DBP completely lost rhythmicity. Gray bars indicate the dark phase (ZT12-24). SCNx; SCN lesioned, COG; center of gravity, R2; inter individual variability, eWAT epididymal white adipose tissue, sWAT subcutaneous white adipose tissue
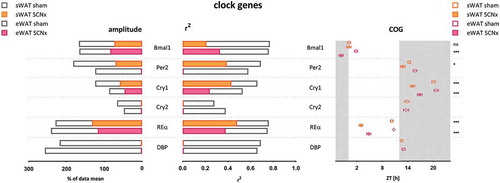
Figure 2. Clock gene rhythms in eWAT and sWAT of sham- and SCN-lesioned animals. Cry2 and DBP lost their rhythmicity after SCN lesions in both WAT compartments, as well as Per2 in eWAT. Bmal1, Per2 in sWAT, Cry1, and RevErbα remained rhythmic after SCN lesions. Gray bars on x-axis indicate the dark phase (ZT12-24). Bar plots represent mean±SEM, scatter plots represent individual data points, area fills represent the curve as fitted by Circwave (www.hutlab.nl)
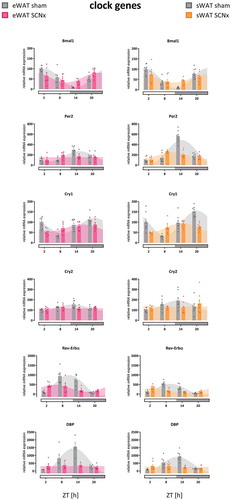
Figure 3. Amplitude, R2, and COG of WAT metabolic gene expression rhythms in sham- and SCN-lesioned animals. NAMPT gene expression remained rhythmic in WAT after SCN lesions, although the amplitude was reduced by 29% in eWAT and 17% in sWAT, and R2 was reduced by 13% in eWAT and 58% in sWAT. The COG remained unaltered. These results indicate that NAMPT rhythmicity was affected less by SCN lesions than any of the other genes measured, including the core clock genes. Absence of data for FAS, CPT1B, GLUT4, adiponectin, and resistin indicates absence of rhythmicity as calculated by Circwave; it does not indicate absence of gene expression
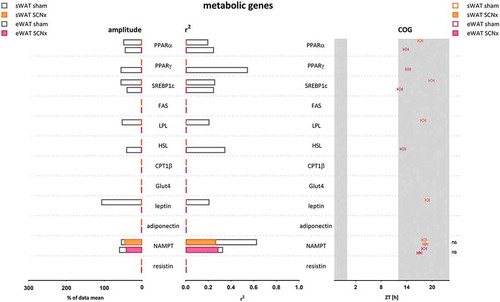
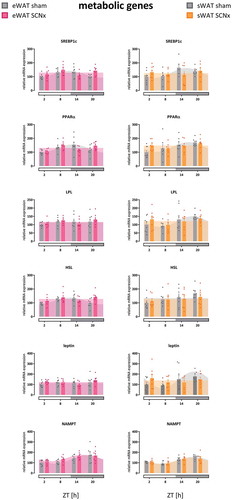
Figure 4. Metabolic gene expression rhythms in eWAT and sWAT of sham- and SCN-lesioned animals. Most metabolic genes lost their daily rhythmicity, with the exception of NAMPT. See supplemental Figure 6 for additional genes. Horizontal gray bars on x-axis indicate the dark phase (ZT12-24). Bar plots represent mean±SEM, scatter plots represent individual data points, area fills represent the curve as fitted by Circwave (www.hutlab.nl)