
Figures & data
Figure 1. PRISMA 2020 flow diagram (Page et al. Citation2021) of the study selection process.
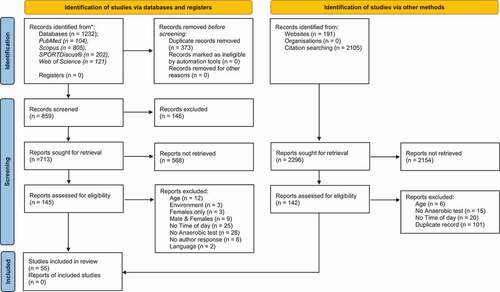
Table 1. Summary of the articles reviewed for anaerobic power (n = 16) with an overview of the participants, the experimental protocols with the time-of-day, exercise mode, performance test, the variables examined, and the main findings related to time-of-day in relation to each variable
Table 2. Summary of the articles reviewed for anaerobic capacity (n = 30) with an overview of the participants, the experimental protocols with the time-of-day, exercise mode, performance test, the variables examined, and the main findings related to time-of-day in relation to each variable
Table 3. Summary of the articles reviewed which conducted an anaerobic power and anaerobic capacity test (n = 9) with an overview of the participants, the experimental protocols with the time-of-day, exercise mode, performance test, the variables examined, and the main findings related to time-of-day in relation to each variable
Table 4. Detailed information related to randomization, counterbalancing, record of light intensity, control of meals, control of room temperature, control of sleep and fitness for articles related to chronobiology (time-of-day)
Table 5. Results of the detailed methodological quality assessment scores based on a modified 26-item Downs and Black (Citation1998) checklist