Figures & data
Table 1. Participant demographics by faculty of enrolment (percentages are as a function of column totals).
Figure 1. Self-rated sleep quality during COVID-19 restrictions against PSQI global score.
Table 2. PSQI scores during COVID restrictions.
Figure 2. (a) Comparison of bedtimes to nearest half-hour, before and during COVID restrictions. (b) Comparison of wake times to nearest half-hour, before and during COVID restrictions.
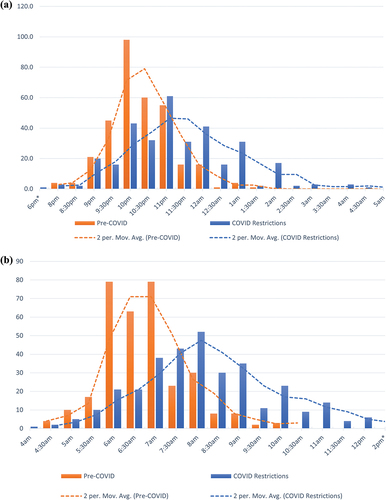
Table 3. Change to positive sleep hygiene behaviours during COVID-19 restrictions and mean PSQI global score.
Table 4. Change to negative sleep hygiene behaviours during COVID-19 restrictions and mean PSQI global score.
Table 5. Effect of COVID restrictions on frequency of experiencing negative emotions and mean PSQI global score.
Table 6. Effect of COVID restrictions on frequency of experiencing positive emotions and mean PSQI global score.
Table 7. Effect of COVID restrictions on experience of symptoms associated with depression (DSM-V) and mean PSQI global score.
Figure 3. Number of hours dedicated to sleep education in current degree by faculty.
Figure 4. Self-rating of “sleep hygiene” knowledge by faculty.