
Figures & data
Figure 1. Global changes in breast and prostate cancer incidence ASRs (a) and overweight/obesity prevalence rates, % (b).
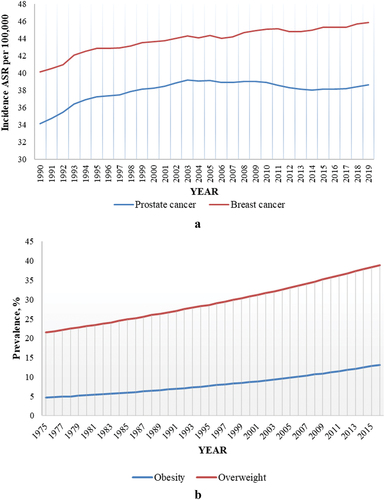
Figure 2. ALAN emissions and solar radiation worldwide.
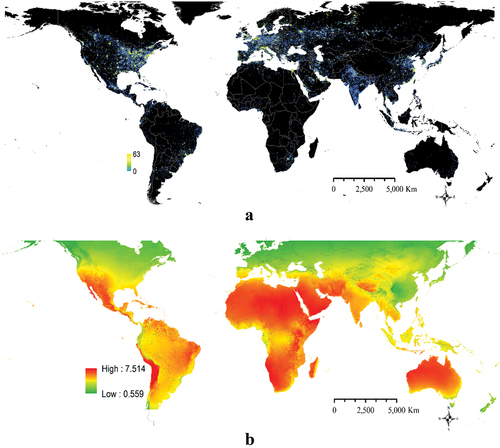
Figure 3. Population-weighted ALAN and solar radiation levels by countries worldwide.
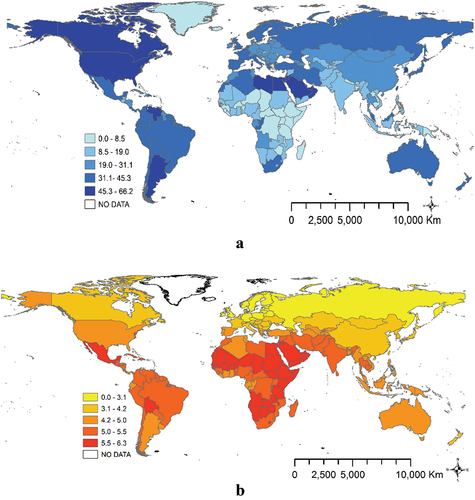
Table 1. Descriptive statistics of the research variables.
Figure 4. Morbidity rates by countries worldwide in 2016.
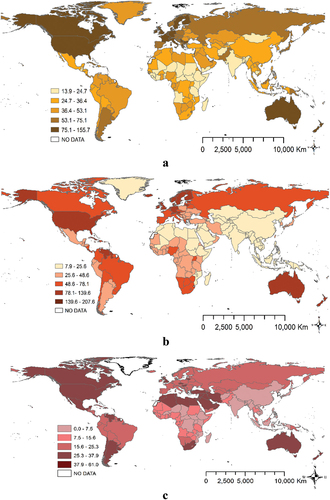
Figure 4. (Continued).
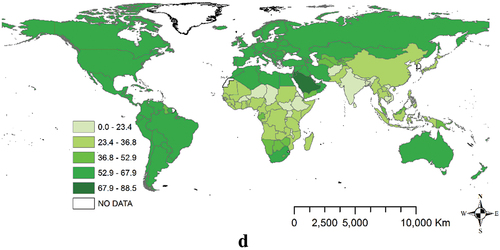
Figure 5. T-statistics of the ALAN and solar radiation variables, estimated for separate years between 1998 and 2016 for different types of morbidity.
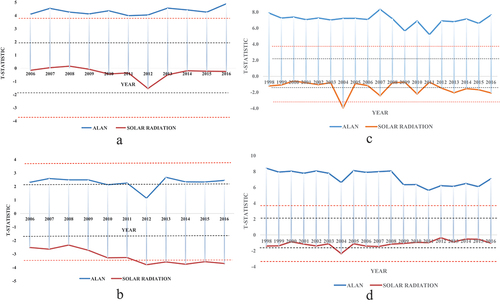
Figure 6. Relative contribution of different factors to obesity (a), overweight (b), BC (c), and PC (d).
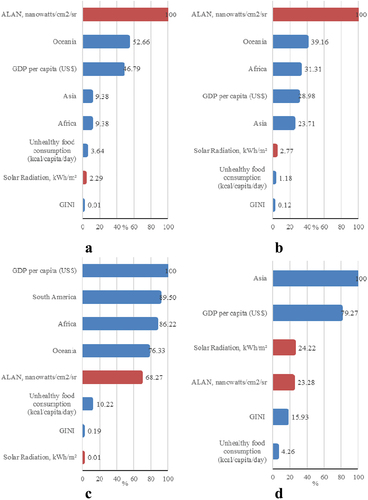
Figure A1. Population-weighted national averages of solar radiation by countries worldwide, kWh/m².
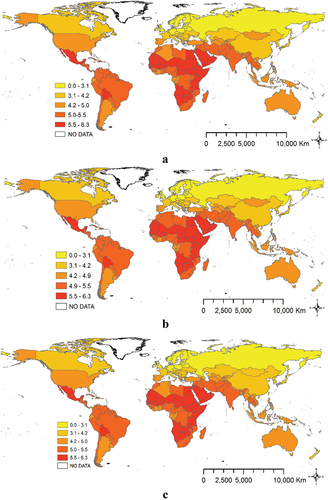
Figure A1. (Continued).
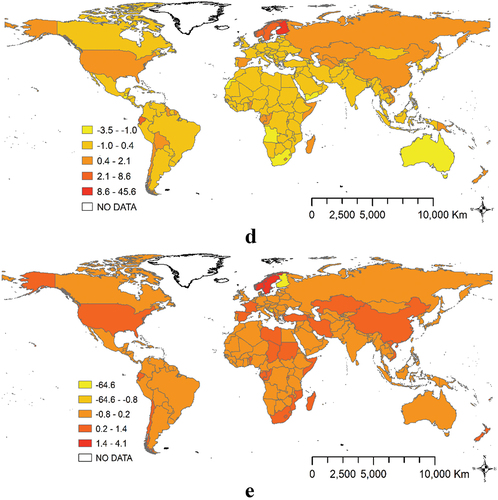
Figure B1. Population-weighted ALAN averages by countries worldwide, nanowatts/cm2/sr.
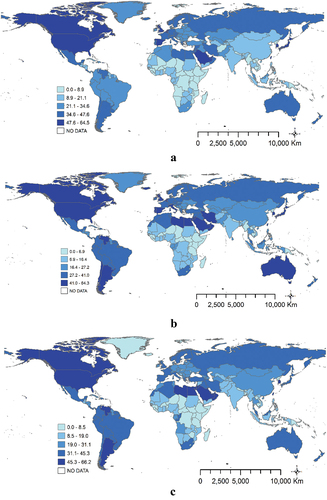
Figure B1. (Continued).
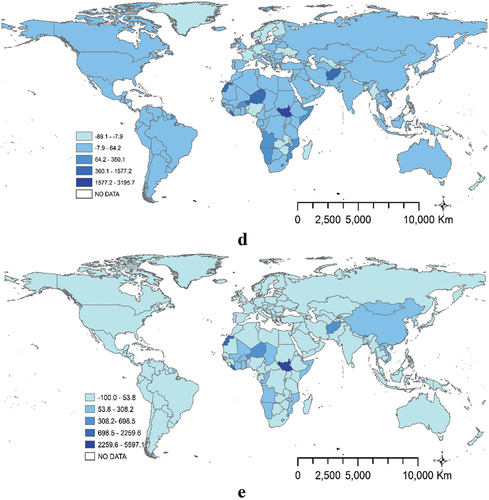
Figure C1. BC rates by countries worldwide.
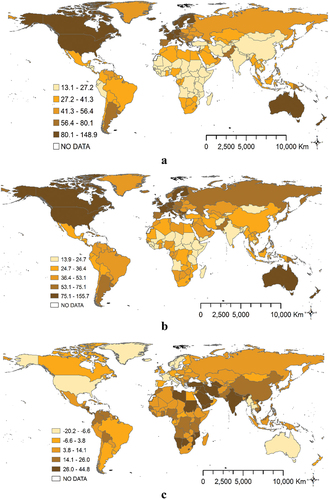
Figure D1. BC rates by countries worldwide.
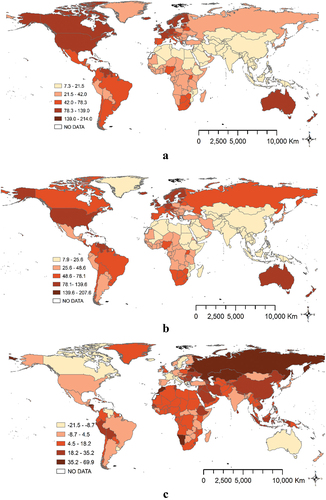
Figure E1. Overweight ASR by countries worldwide, %.
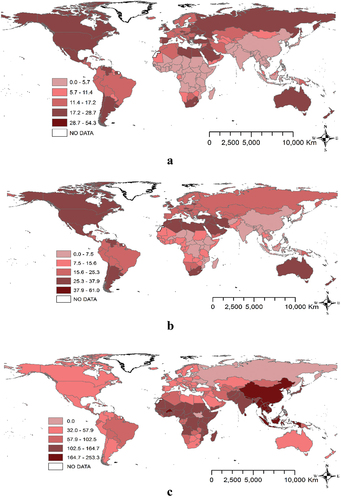
Figure F1. Overweight ASR by countries worldwide, %.
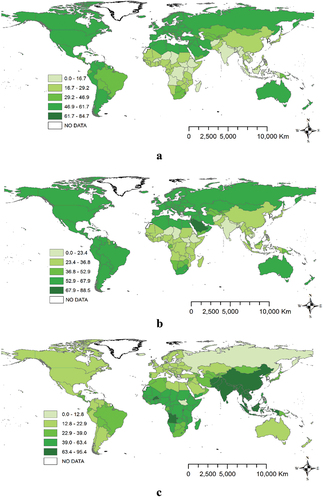
Table G1. Factors affecting obesity rates in individual countries of the world (Dependent variable – Obesity, % ASR in the years 1998; 1999; 2000 and 2001; explanatory 2-year latency period, unless stated otherwise).
Table G2. Factors affecting obesity rates in individual countries of the world (dependent variable – obesity, % ASR in the years 2002; 2003; 2004 and 2005; explanatory 2-year latency period, unless stated otherwise).
Table G3. Factors affecting obesity rates in individual countries of the world (dependent variable – obesity, % ASR in the years 2006; 2007; 2008 and 2009; explanatory 2-year latency period, unless stated otherwise).
Table G4. Factors affecting obesity rates in individual countries of the world (dependent variable – obesity, % ASR in the years 2010; 2011; 2012 and 2013; explanatory 2-year latency period, unless stated otherwise).
Table G5. Factors affecting obesity rates in individual countries of the world (dependent variable – obesity, % ASR in the years 2014; 2015 and 2016; explanatory 2-year latency period, unless stated otherwise).
Table G6. Factors affecting obesity rates in individual countries of the world (dependent variable – obesity, % ASR in the years 2015 and 2016 explanatory 2-year latency period, unless stated otherwise).
Table G7. Factors affecting overweight rates in individual countries of the world (dependent variable – overweight, % ASR in the years 1998; 1999; 2000 and 2001 explanatory 2-year latency period, unless stated otherwise).
Table G8. Factors affecting overweight rates in individual countries of the world (dependent variable – overweight, % ASR in the years 2002; 2003; 2004 and 2005 explanatory 2-year latency period, unless stated otherwise).
Table G9. Factors affecting overweight rates in individual countries of the world (dependent variable – overweight, % ASR in the years 2006; 2007; 2008 and 2009 explanatory 2-year latency period, unless stated otherwise).
Table G10. Factors affecting overweight rates in individual countries of the world (dependent variable – overweight, % ASR in the years 2010; 2011; 2012 and 2013 explanatory 2-year latency period, unless stated otherwise).
Table G11. Factors affecting overweight rates in individual countries of the world (dependent variable – overweight, % ASR in the years 2014; 2015 and 2016 explanatory 2-year latency period, unless stated otherwise).
Table G12. Factors affecting overweight rates in individual countries of the world (dependent variable – overweight, % ASR in the years 2015 and 2016 explanatory 2-year latency period, unless stated otherwise).
Table G13. Factors affecting breast cancer rates in individual countries of the world (dependent variable – breast cancer rate ASR in the years 2006; 2007; 2008 and 2009 explanatory 10-year latency period, unless stated otherwise).
Table G14. Factors affecting breast cancer rates in individual countries of the world (dependent variable – breast cancer rate ASR in the years 2010; 2011; 2012 and 2013 explanatory 10-year latency period, unless stated otherwise).
Table G15. Factors affecting breast cancer rates in individual countries of the world (dependent variable – breast cancer rate ASR in the years 2014; 2015 and 2016 explanatory 10-year latency period, unless stated otherwise).
Table G16. Factors affecting prostate cancer rates in individual countries of the world (dependent variable – prostate cancer rate ASR in the years 2006; 2007; 2008 and 2009 explanatory 10-year latency period, unless stated otherwise).
Table G17. Factors affecting prostate cancer rates in individual countries of the world (dependent variable – prostate cancer rate ASR in the years 2010; 2011; 2012 and 2013 explanatory 10-year latency period, unless stated otherwise).
Table G18. Factors affecting prostate cancer rates in individual countries of the world (dependent variable – prostate cancer rate ASR in the years 2014; 2015 and 2016 explanatory 10-year latency period, unless stated otherwise).