Figures & data
Table 1. Sample socio-demographics, symptom total scores, and chronotype at baseline and follow-up assessments (N = 118).
Table 2. Sample characteristics and clinical scores by diagnostic group.
Figure 1. Morningness-Eveningness Questionnaire (MEQ) categories and total scores at baseline and follow-up across diagnostic groups.
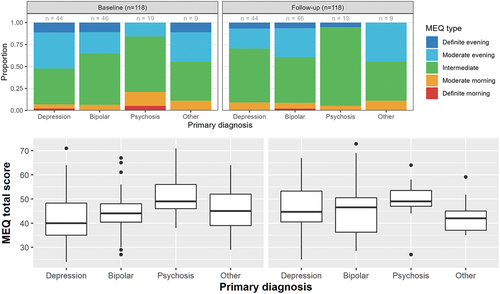
Table 3. Fit indices for the univariate latent change score models.
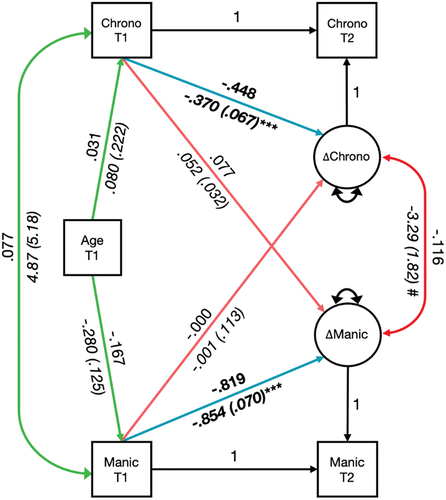
Table 4. Path coefficients for bivariate latent change score models. Single-headed arrows (→) indicate a regression path; the double-headed arrows (↔) indicate a covariance path.
Figure 2. Bivariate latent change score model of depressive symptoms and chronotype at baseline (T1) and follow-up (T2) assessments.
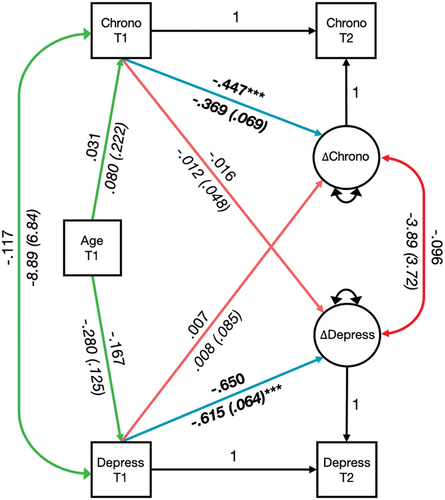
Figure 3. Bivariate latent change score model of hypo/manic symptoms and chronotype at baseline (T1) and follow-up (T2) assessments.