
Figures & data
Figure 1. Flow diagram of the study participants.
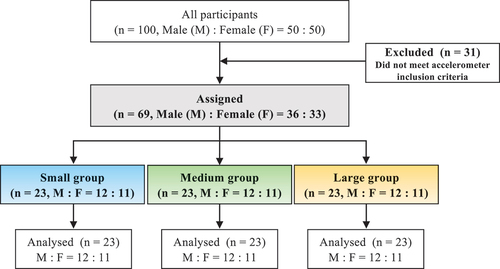
Table 1. Characteristics of study participants.
Figure 2. Circadian activity rhythm assessment and grouping. (1) Each participant is asked to wear an accelerometer for at least 6 consecutive days (including at least 1 holiday). (2) the cosinor method is used to evaluate the circadian activity rhythm from the obtained accelerometer data. The acrophase (peak time), amplitude, and goodness of fit (rhythmicity) of the normalized data are determined using the single cosinor method. For disruption of circadian activity rhythms, the peak phase (acrophase) is first estimated by fitting the daily physical activity data to a cosine curve. (3) the difference in the peak phase (time) is then determined up to day 6, using the acrophase on day 1 as the reference, as the difference between days 1 and 2 and between days 1 and 3. The standard deviation (SD) of the mean 6-day difference in the peak phase is calculated. (4) the higher the SD value, the more disrupted the circadian activity rhythm. SD is used after logarithmic transformation (Log SD). SD, standard deviation.
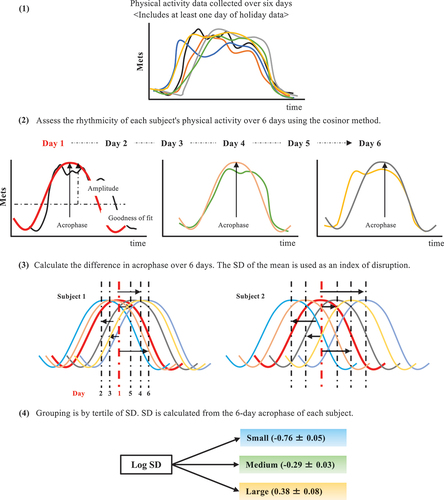
Figure 3. Comparison of circadian activity rhythm disruption. SD is used after logarithmic transformation (Log SD). SD, standard deviation. ***p < 0.001 compared with the Log SD among groups (Tukey).
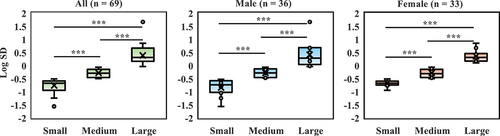
Table 2. Amplitude, acrophase, and goodness of fit of circadian activity rhythm.
Figure 4. Comparison of obesity-related indices among groups. (a) All participants (n = 69), (b) men participants (n = 39), (c) women participants (n = 33). BMI, body mass index; %Fat, body fat percentage. Body mass and BMI are used after logarithmic transformation (Log BM, Log BMI). %Fat is used after arcsine transformation (arcsine %Fat). *p < 0.05 compared with the obesity-related indices among groups (Tukey).
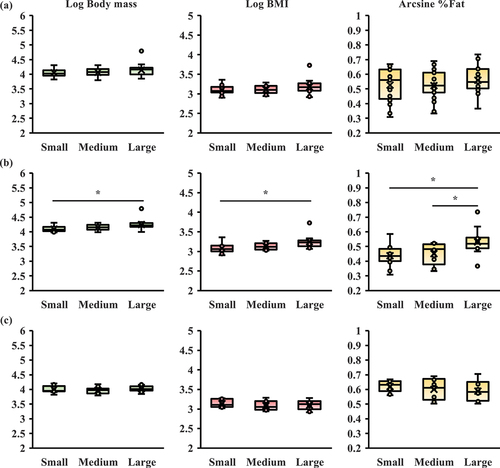
Figure 5. The association between disruption of circadian activity rhythms (Log SD) and %Fat. For all participants (n = 69), sex is the controlling variable of partial correlation. Male (n = 36) and female participants (n = 33) calculate Pearson’s product-moment correlation coefficient. SD is used after logarithmic transformation (Log SD). %Fat is used after arcsine transformation (arcsine %Fat).
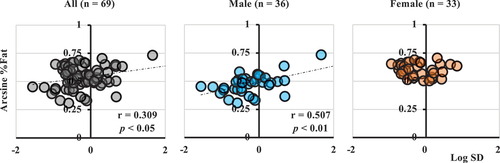
Table 3. The relationship between circadian activity rhythms and obesity-related indices and physical activity.
Table 4. Multiple linear regression analysis for the %Fat, BMI, and body mass.
Supplemental Material
Download PDF (141.4 KB)Data availability statement
The data supporting the results of this study are available upon request from the corresponding author, Hyeon-Ki Kim. The data are not publicly available due to restrictions that include information that could compromise the privacy of research participants.