
Figures & data
Figure 1. Flowchart in- and exclusions in the RESTED study, sample sizes per group and per measurement time point and drop-outs and missing measurements per time point and group.
Table 1. Characteristics of the transmasculine (TM) and transfeminine (TF) groups reported per measurement time point.
Figure 2. The mean sleep duration (line) and sleep debt-corrected midpoint of sleep on free days (point) before GAHT (baseline; displayed as the top orange bar) compared to after 3 months of GAHT (displayed as the bottom green bar). The Y-axis displays the groups, the X-axis displays the mean sleep duration (as a line) and mean sleep debt-corrected midpoint of sleep (as a point) in hours.
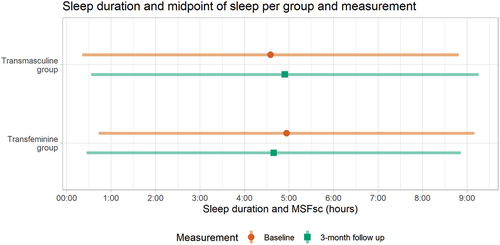
Table 2. Sleep duration and (sleep-corrected) Midpoint of Sleep on Free days (MSFsc) obtained from the µMCTQ in the transmasculine (TM) group and the transfeminine (TF) group. All variables are reported in clock hours (hh:mm).
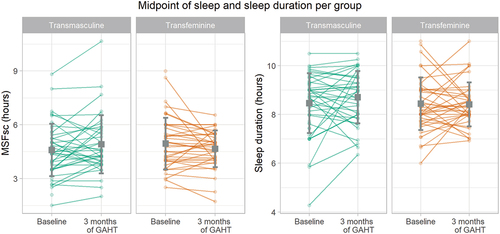
Figure 3. Sleep debt-corrected midpoint of sleep on free days (left) and sleep duration (right) per group and time point. Individual dots display every participants’ measurements, lines connect the participants’ measurements, the gray squares represent the means and the error bars represent the standard deviations per measurement time point and group.
Supplemental Material
Download PDF (111.2 KB)Data availability statement
Data available on request