Figures & data
Figure 1. A typical MVC with twitches superimposed. Panel a illustrates the timing of the twitches whilst panel b illustrates the participants achieved force rate.
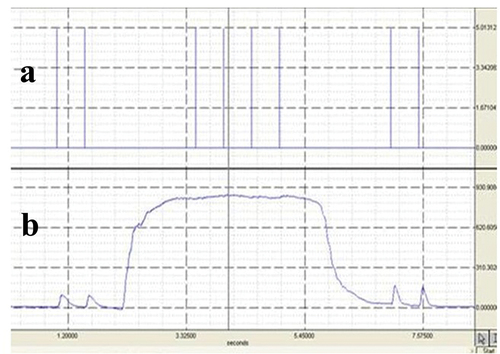
Figure 2. Schematic of the research design and experimental protocol, the thermometer image represents Trec and Tm taken.
Figure 3. Mean (95%CI) values for both resting rectal and muscle temperature for the four times of day.
Table 1. Population cosinor results for rectal temperature, resting muscle temperature, and all POMS category scores during the live normal protocol (four times of measurement). 95% confidence intervals are inserted when significance observed. Bold values indicate statistical significance (p < 0.05).
Table 2. Population cosinor results for pre-test muscle temperature and all biodex isokinetic dynamometry results during the protocol (four times of measurement). Bold values indicate statistical significance (p < 0.05).
Table 3. Population cosinor results for pre-test muscle temperature and all isometric percutaneous stimulation results during the protocol (four times of measurement).
Table 4. Population cosinor results for pre-test muscle temperature and all muscle lab.
Figure 4. Mean (95%CI) values for both back squat and Bench Press (both loads) for the four times of day. # represents main effect for load, * represents main effect for time of day, † represents and interaction for time of day by load.