
Figures & data
Table 1. Core domains and underlying constructs of communicative competence.
Table 2. Characteristics of the participants.
Table 3. Total test statistics per core domain in study 1.
Table 4. Mokken scale statistics per core domain.
Table 5. Latent correlations between the subscales in children with typical development (above diagonal) and Down syndrome (below diagonal) groups.
Table 6. Total test statistics per core domain in study 2 and 3.
Figure 1. Mean scores, divided by the subscale maximum, by age for each of the core domains, in the typical development (TD) and Down-syndrome (DS) groups.
Note. Thin grey lines indicate 25th and 75th percentile in the sample of children with typical development.
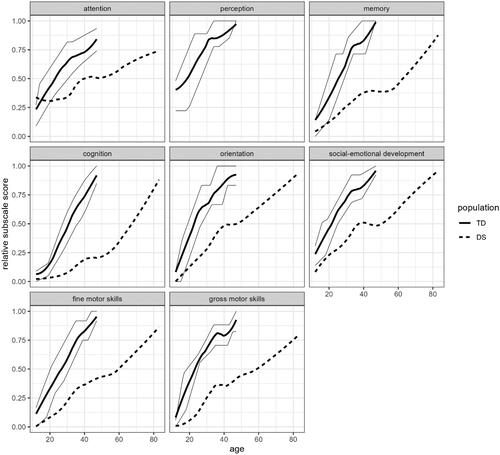
Table 7. Latent correlations with the ELS in study 2 and 3, and observed correlation with CM in study 3.
Table 8. AAC strategies connected to underlying domains of communicative competence.