Figures & data
Figure 1. Overview of the Process to Generate Synthetic Child Speech for Each South African Language Using Tacotron 2.
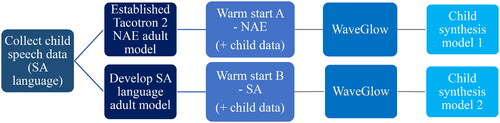
Figure 2. MOS Responses, with Reference to Speaker, Language, and Warm Start Type.
Note. This figure presents MOS responses categorized by speaker type (adult and child), language (Afrikaans/AFR, South African English/SAE, and isiXhosa/XHO), and warm start type (North American English/NAE, and South African/SA). The vertical axis represents MOS responses from 0 (completely unnatural) to 4 (completely natural), while the horizontal axis denotes the different languages. Each language corresponds to a specific combination of speaker and warm start type, providing a comprehensive overview of the perceived speech synthesis quality across these dimensions.
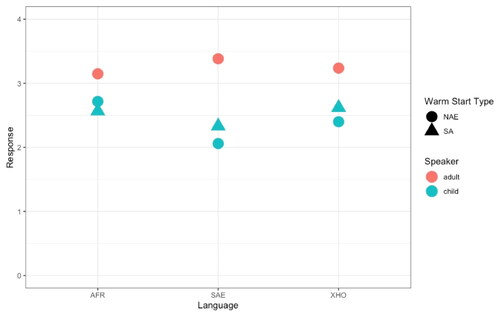
Table 1. Fixed effects coefficients of all the voices.
Table 2. Fixed effects coefficients of the child voices.
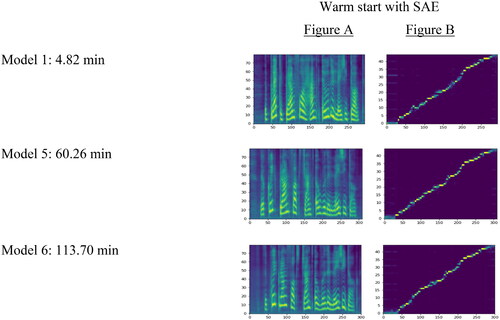
Figure 3. Tacotron 2 Mel-Spectrogram (a) and Alignment (b) Plots of Synthesized Speech: “The Quick Brown Fox Jumped Over the Lazy Dog”.
Note. The mel-spectrogram is a spectrogram with the mel scale as its y-axis. It is a good indicator of the signal strength at various frequencies in the waveform. The alignment plot is a quick way to visualize a model’s success. A straight diagonal line from the bottom left to the top right is a good indicator that the model is producing something similar to speech.