Figures & data
Figure 1 Study lake locations and ecoregion map. 2006 study and 2007 National Lake Assessment Project (NLAP) sites noted.
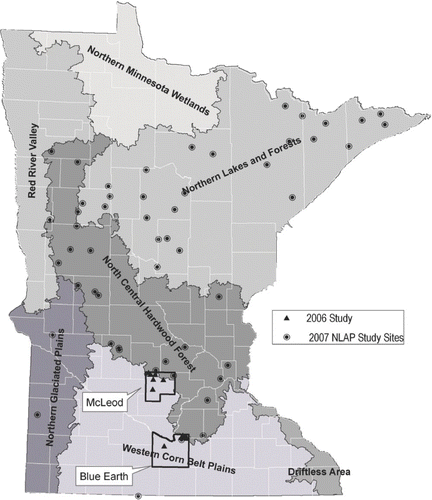
Table 1 2006 Study lake morphometric and watershed characteristics
Table 2 Minnesota Department of Health laboratory methods and precision estimates
Table 3 Summer-mean pelagic water quality 2006: McLeod County lakes. Last column represents the Western Cornbelt Plain (WCBP) ecoregion reference lake interquartile range (CitationHeiskary and Wilson 2008)
Table 4 Summer-mean pelagic water quality 2006: Blue Earth County lakes. Last column represents the NCHF ecoregion reference lake interquartile range (CitationHeiskary and Wilson 2008)
Figure 2a Pelagic chlorophyll-a concentration by lake and date for 2006 study. Severe nuisance bloom level (30 μg/L) noted by heavy black line for perspective. Concentrations beyond scale are noted immediately below bars and ordered by date.
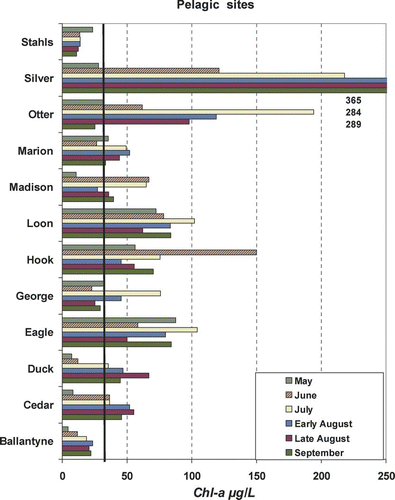
Figure 2b Near-shore chlorophyll-a concentrations by lake and date for 2006 study. Severe nuisance bloom level (30 μg/L) noted by heavy black line for perspective. Concentrations beyond scale are noted immediately below bars and ordered by date.
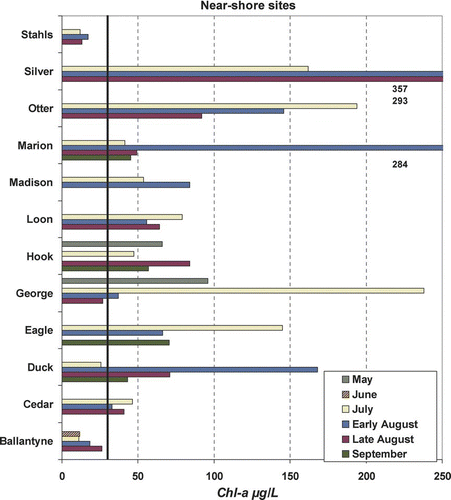
Figure 3a Pelagic microcystin (MC) concentrations by lake and date for 2006 study.
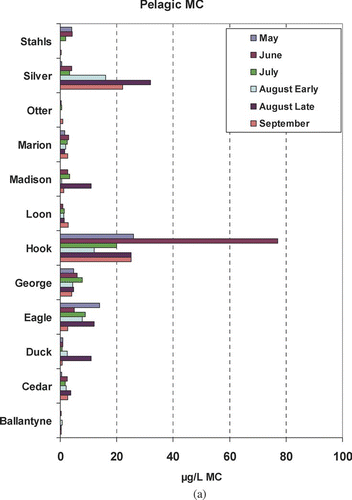
Figure 3b Near-shore microcystin (MC) concentrations by lake and date for 2006 study. MC concentrations beyond scale noted on graph.
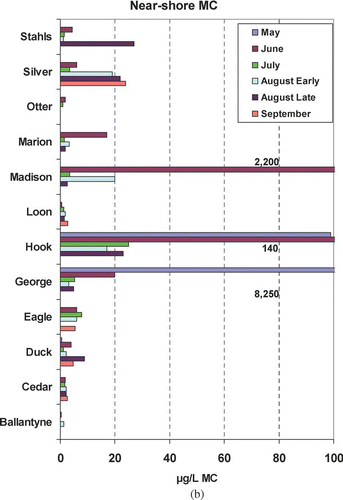
Figure 4 Microcystin (MC) frequency distributions for 2006. Comparisons for (a) pelagic vs. near-shore MC and (b) near-shore (MC) for scum vs. no scum.
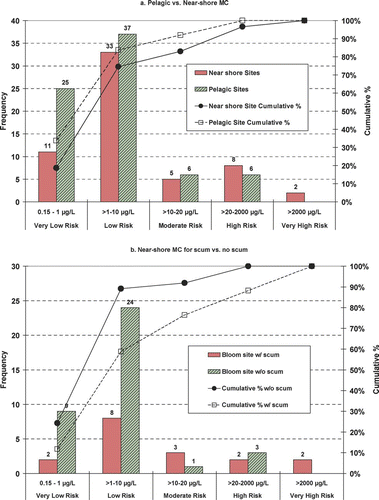
Figure 5 Spearman Correlation Coefficients (Rs) for microcystin (MC) and various chemical, physical and biological variables. See for complete parameter names and units.
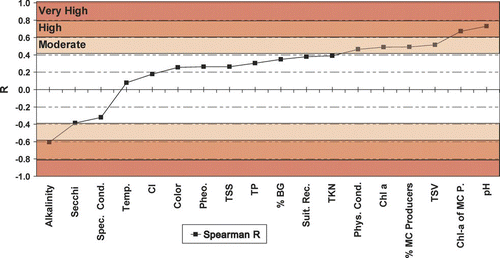
Figure 6 Cross tabulation of microcystin (MC) relative to: (a) Chlorophyll-a (bloom intensity) (108 pairs), (b) Secchi (69 pairs) and (c) pH (91 pairs) based on 2006 data. Number of observations in each category noted.
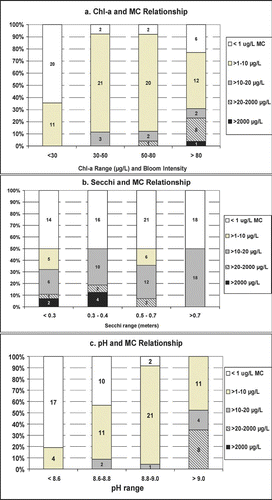
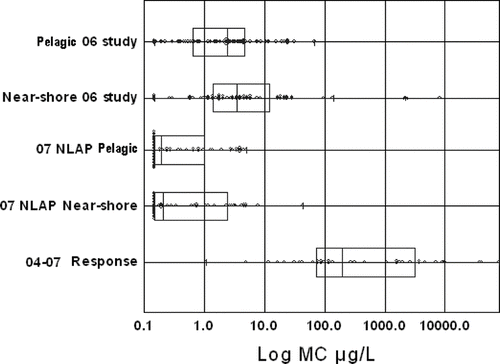
Figure 7 Microcystin (MC) box and whisker plots by study and site location for 2006 pelagic and near-shore samples; 2007 NLAP pelagic and near-shore samples, and 2004–2007 incident-based samples.