Figures & data
Figure 1 A map of the Rotorua District, New Zealand showing the twelve lakes under management in this district. The enlarged area is shown as .
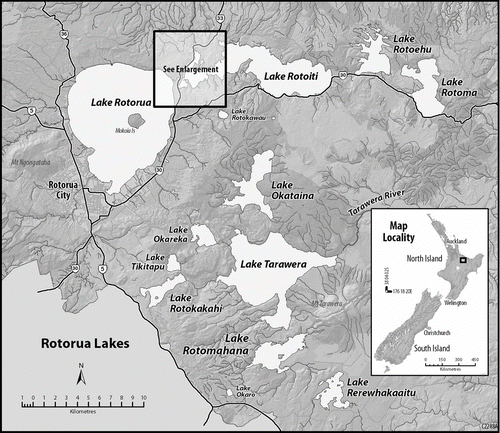
Table 1 Long-term trends and three yearly average TLI values for the Rotorua District lakes in comparison to the TLI values set in the Regional Water and Land Plan, together with LakeSPI condition.
Figure 2 Map of Lakes Rotorua and Rotoiti showing the Ohau Channel and the Kaituna River.
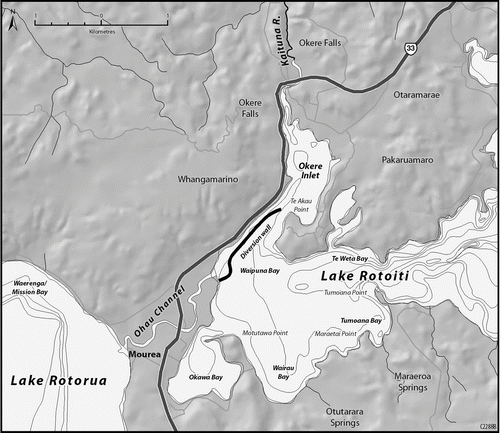
Figure 3 Average total phosphorus and annualized residual concentrations for Lake Okaro.
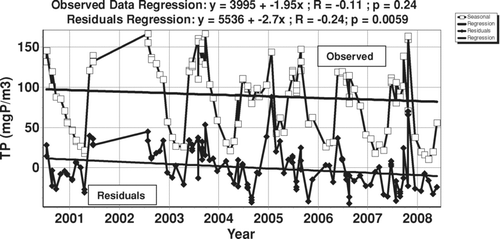
Table 2 TLI Report for Lake Rotoma.
Figure 4 Current and planned future nutrient loads to lake Rotoma.
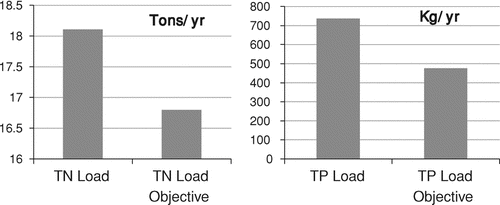
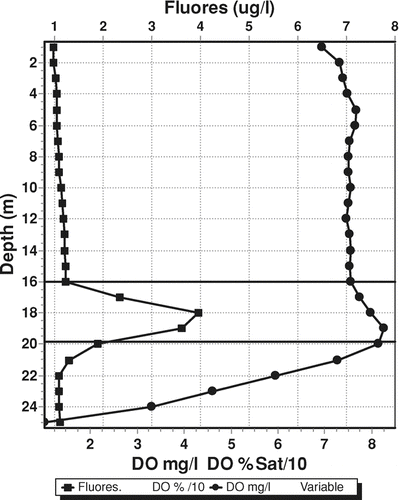
Figure 5 Fluorescence and dissolved oxygen profiles on April 24, 2007 at Site 1, Lake Tikitapu (fluorescence units – μL as Chla equivalent).