Figures & data
Figure 1 Moses Lake showing the source of Columbia River dilution water from the East Low Canal (1) entering via Rocky Coulee Wasteway (2) into Crab Creek and then into Parker Horn. Water sampling sites are shown by number and solid lines for transects.
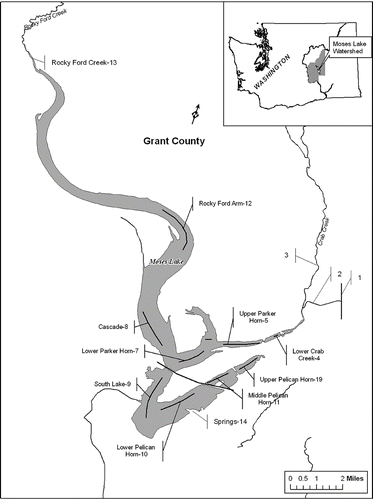
Table 1 Mean TP, chl and transparency (SD) during May–September in Parker Horn (PH) and South Lake (SL) of Moses Lake. Data are based on transect samples collected at 0.5 m (CitationWelch et al., 1989), and for discrete samples at 0.5 m in 2001 (CitationCarroll 2006). Data omitted were from 1985, due to high internal loading (see text), and 1984, the year of diversion and no dilution water addition. Trophic state boundaries from CitationNürnberg (1996).
Figure 2 The quantity of Columbia River dilution water in 106 m3 (solid bars) added during spring-early summer to Parker Horn of Moses Lake from the East Low Canal through Rocky Coulee Wasteway and Crab Creek. Clear bars are water exchange rates for the Parker Horn volume in %/day for the 6-month dilution period, and whole-lake volume is 154 × 106 m3.
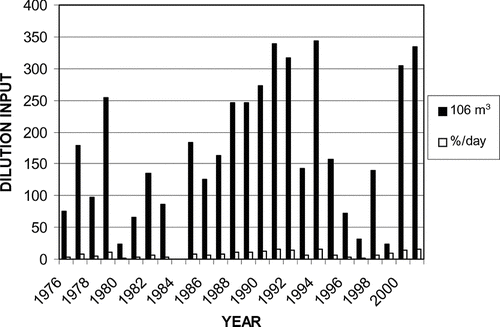
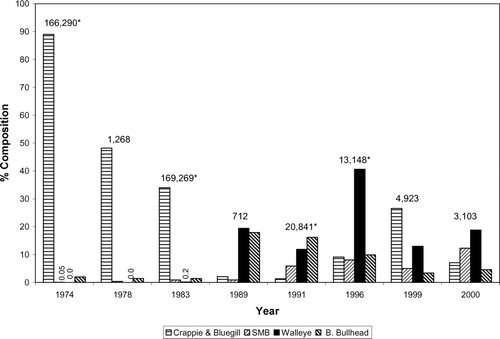
Figure 3 Angler catch* in 1974, 1983, 1991 and 1996, and biological sampling (electrofishing and gill netting) in the other years, expressed as % of total catch, shown at the top of bars for each year (CitationBurgess 2000, CitationBurgess et al. 2007).