Figures & data
Table 1 Summary statistics for nutrients (μ g/L), chlorophyll (μ g/L), Secchi depth (m) and microcystin concentrations (μ g/L) for the annual average of 187 Florida lakes and 862 individual water samples collected Jan to Dec 2006.
Figure 1 The 187 Florida lakes sampled for microcystin Jan to Dec 2006 and the Harris Chain of Lakes (Beauclaire, Dora [East and West], Eustis, Harris and Griffin) located in Lake County, FL, sampled for microcystin Sep 2006 to Aug 2007.
![Figure 1 The 187 Florida lakes sampled for microcystin Jan to Dec 2006 and the Harris Chain of Lakes (Beauclaire, Dora [East and West], Eustis, Harris and Griffin) located in Lake County, FL, sampled for microcystin Sep 2006 to Aug 2007.](/cms/asset/9dcae741-dae7-480e-b94f-139f934865b8/ulrm_a_413828_o_f0001g.gif)
Figure 2 The mean percent difference of microcystin concentrations from annual means averaged across time periods for individual water samples categorized into trophic states and the individual water samples (hypereutrophic) from the Harris Chain of Lakes. The number of individual water samples for each time period is listed. Error bars represent the standard error of the mean for the mean percent differences of each time period.
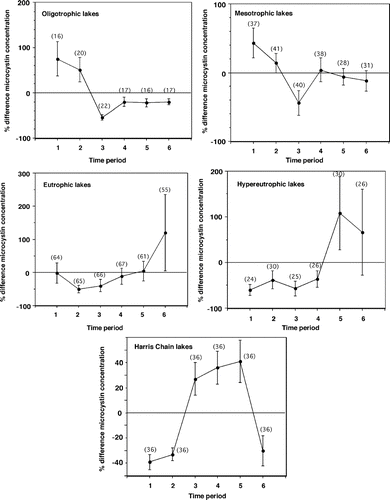
Table 2 Percent by trophic state category (based on chlorophyll concentrations), in which microcystins were detected (≥ 0.1 μ g/L) for the 187 Florida lakes (annual average) and 862 individual water samples collected Jan to Dec 2006.
Figure 3 Individual samples (○) measured for microcystin concentration (N = 862) from 187 Florida lakes sampled Jan to Dec 2006. Total algal biomass values were calculated from chlorophyll concentrations using an equation specific to Florida (CitationCanfield et al. 1985). The closed circles (•) represent the relationship between total algal biomass and percent algal contribution for cyanobacteria in Florida lakes as suggested by CitationDuarte et al. (1992).
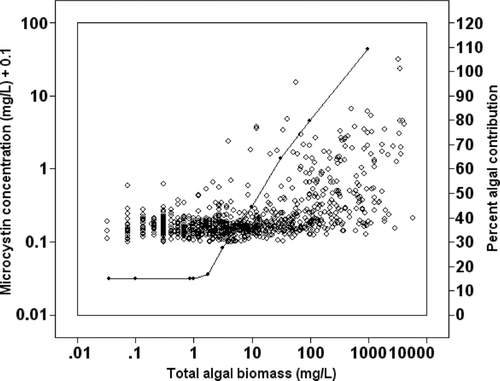
Table 3 Probability (%) that microcystin concentrations (μ g/L) will exceed the listed WHO microcystin guidance values as suggested by the chlorophyll concentration (μ g/L) categories, which were constructed to include at least 50 of the individual water samples (N = 856) collected from the 187 Florida lakes.
Table 4 Probability (%) that microcystin concentrations (μ g/L) will exceed the listed WHO microcystin guidance values as suggested by the Secchi depth (m) categories, which were constructed to include at least 50 of the individual water samples (N = 788) collected from the 187 Florida lakes.
Table 5 Summary statistics for nutrient (μ g/L), chlorophyll (μ g/L), Secchi depth (m) and microcystin concentrations (μ g/L) of 216 individual samples collected from Sep 2006 to Aug 2007 from six Harris Chain of Lakes located in Lake County, FL.
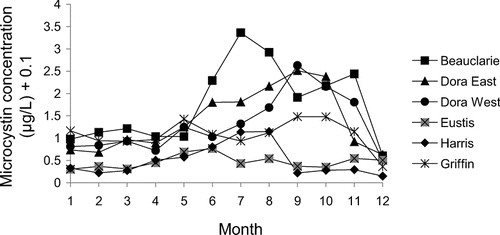
Figure 4 Mean monthly microcystin concentrations for six Harris Chain of Lakes located in Lake County, FL, sampled Sep 2006 to Aug 2007.