Figures & data
Figure 1 Bathymetric map of Newman Lake, Washington showing major stream and sample site locations. Depth contours are in feet (after CitationWolcott 1964).
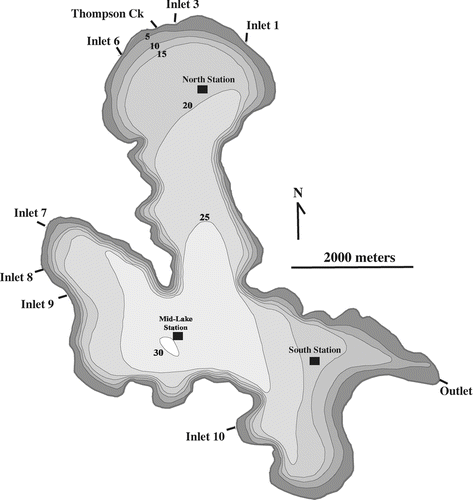
Figure 2 Total phosphorus concentrations in Thompson Creek, Newman Lake watershed, WA. Y-axis values are in μg-P/L. Circles = annual median TP concentrations; shaded boxes = 95% confidence intervals. Median TP for data up to 2002 is 47 μg-P/L.
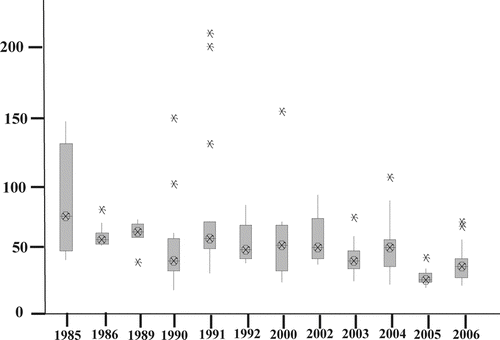
Figure 3 Average annual volume-weighted total phosphorus in Newman Lake. Y-axis values are in μg-P/L. 1989 = whole lake alum treatment; 1992 = hypolimnetic oxygenation installed; 1997 = 100-yr flood event; 1997 = microfloc alum installed; 2000 = oxygenation and alum systems out of service (see text for details).
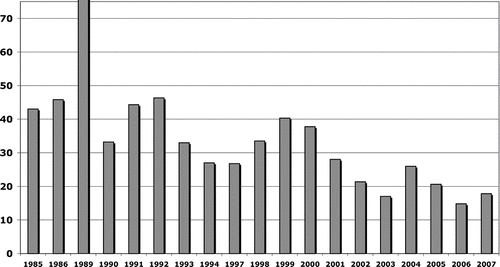
Figure 4 Box plots of annual volume-weighted total phosphorus concentrations in Newman Lake, grouped by treatment intervals. Y-axis values are in μg-P/L. Squares = median values; shaded boxes = inner quartiles, including data +/- 25% of medians; whiskers = minimum/maximum lines. (a) Annual volume-weighted, whole-lake TP for all stations and all depths (n = 1420). (b) Annual volume-weighted epilimnion TP (n = 475). (c) Annual volume-weighted metalimnion TP (n = 472). (d) Annual volume-weighted hypolimnion TP (n = 473).
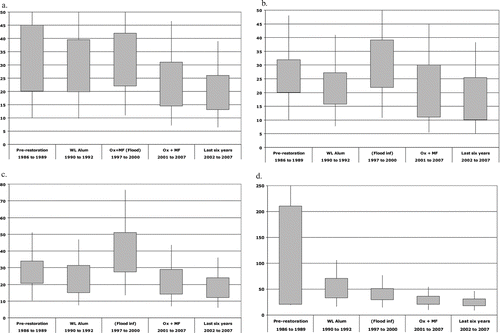
Figure 5 Frequency histograms for volume-weighted TP in Newman Lake. Y-axis in percentages of total observations; X-axis in μg-TP/L. (A) Cumulative post-restoration data range frequencies (n = 1345) compared to pre-restoration frequencies (n = 176). (B) Histograms for data stratified into pre-oxygenation years (pre-1992, n = 286), years with partial oxygenation (1992–1996, n = 455), and years with full oxygenation (1997–1999 and 2001–2007, n = 780). (C) Histograms for data stratified into pre-oxygenation years (pre-1992, n = 286), and years operated with full oxygenation within the designed system environmental parameters (2001–2007, n = 780) (see text for details).
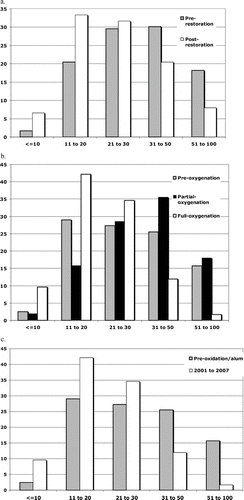
Table 1 Total phosphorus nutrient budget, loading rates and coefficients for Newman Lake, calculated for all years in which sufficient inlet and outlet monitoring data are available. Min Gross = minimum gross yearly total phosphorus load calculated as the sum of all positive loads. Net internal = arithmatic sum of all positive and negative loads. Ltot = total yearly phosphorus load divided by watershed and lake areas. Lext = total annual load from inlets divided by lake area. Robs and Rpred are observed and predicted phosphorus retention coefficients, respectively (see Nurnberg 1984 and text for details). qs = annual areal water load. Anoxic factor is calculated per Nurnberg (1987). Summer values are for the four month period, inclusive of June through September, and summer rates are extrapolated to an annual basis. For 2004 and 2005, rates are extrapolated to an annual basis.
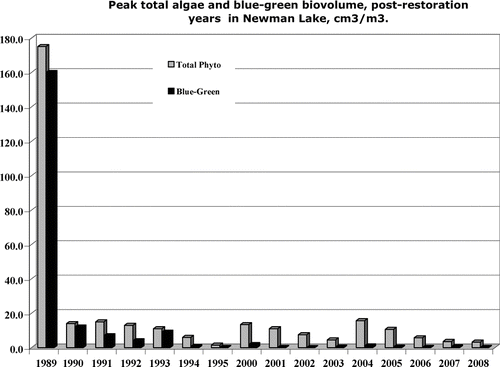
Figure 6 Maximum total and cyanobacteria biovolumes in Newman Lake from 1989 through 2007. Maxima are highest observed for each year and are not necessarily concurrent. Y-axis phytoplankton biovolumes are in cm3/m3.