Figures & data
Figure 1 Features of Lake Waco watershed. Key features include Lake Waco, subwatersheds, major tributaries, PL-566 structures, Confined Animal Feeding Operations (CAFO) and meteorological observation locations relevant to the SWAT simulations.
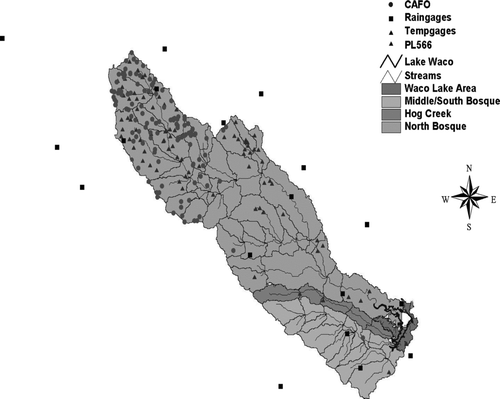
Table 1 Physical characteristics of Lake Waco.
Figure 2 Flow diagram of nutrients, organic matter, algae and sediments represented in the CE-Qual-W2 model.
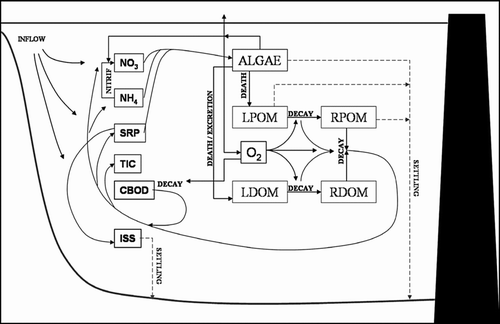
Figure 3 Bathymetry and segmentation areas for the CE-Qual-W2 simulation of Lake Waco.
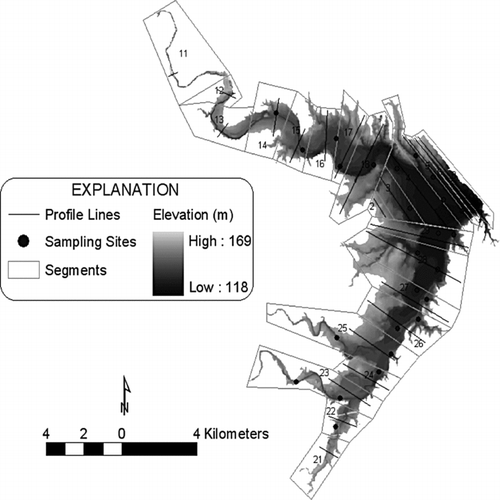
Table 2 Calibration statistics for the SWAT simulations based on a daily timestep for sub-watersheds of Lake Waco. The coefficient of efficiency (COE) was calculated based on CitationNash and Sutcliffe (1970). Time intervals vary among sub-watersheds based on availability of stream flow data.
Table 3 Percent watershed contribution of stream flow, total nitrogen and total phosphorus to Waco Lake as simulated with calibrated SWAT model for 1997–1998.
Figure 4 SWAT predicted (solid line) and observed (open circles) stream flow for the North Bosque River at Valley Mills for the calibration period between Oct 1996 and Sep 1997. Values are in m3/s, and the y-axis is shown in a natural logarithmic scale.
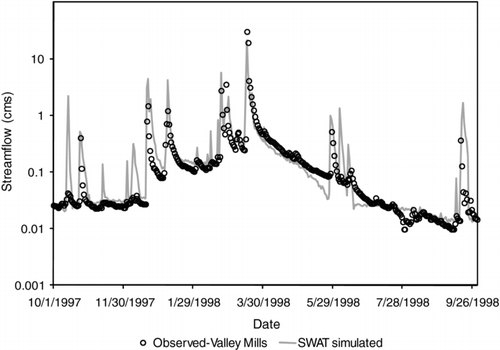
Figure 5 Comparisons of SWAT predicted and observed orthophosphorus-P (kg/d) for collections dates in 1997–1998 for the North Bosque River at the inlet to Waco Lake.
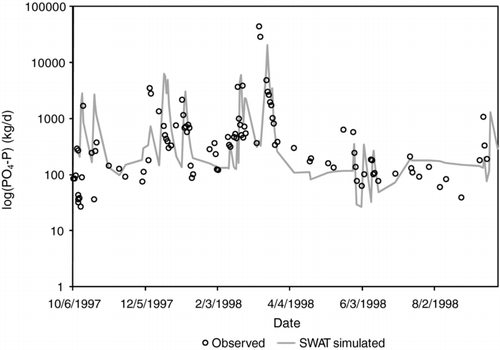
Figure 6 Comparisons of SWAT predicted and observed nitrite plus nitrate-N (kg/d) for collections dates in 1997–1998 for the North Bosque River at the inlet to Waco Lake.
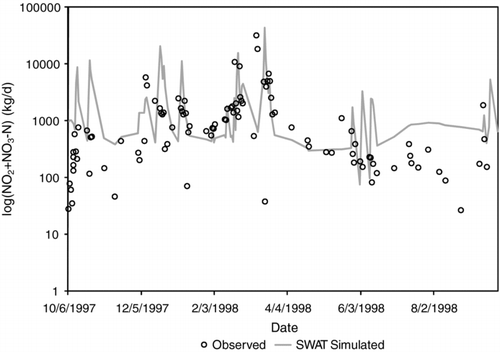
Figure 7 Error assessment based on the root mean squared error (RMSE) analysis for calibration of the CE-Qual-W2 simulations. Simulation iteration number is shown on the x-axis, and MSE between observed and simulated chl-a is shown on the y-axis. The parameter set associated with simulation iteration #43 produced the lowest MSE value of 9.76 μg/L and was used for all subsequent analyses.
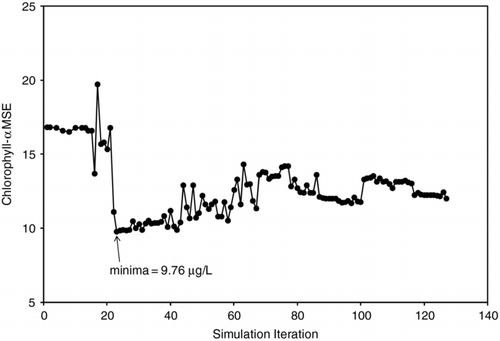
Figure 8 Comparison between observed (open circles) and simulated (solid line) water temperature (C) at 1 m for collections dates in 1997–1998 near the center of Waco Lake.
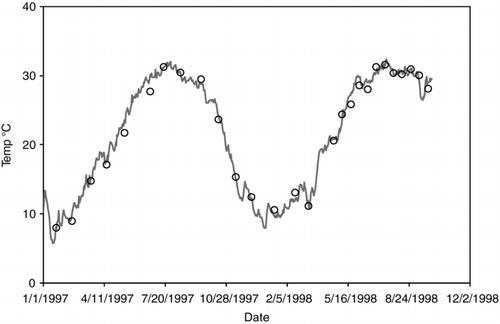
Figure 9 Comparison between observed (open circles) and simulated (solid line) dissolved oxygen (mg/L) at 1 m for collection dates in 1997–1998 near the center of Waco Lake.
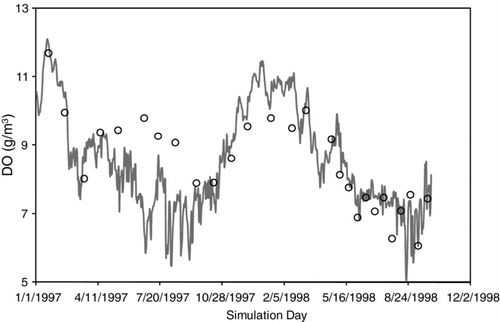
Figure 10 Comparison between observed (open circles) and simulated (solid line) chl-a (mg/m3) at 1 m for collections dates in 1997–1998 near the center of Waco Lake.
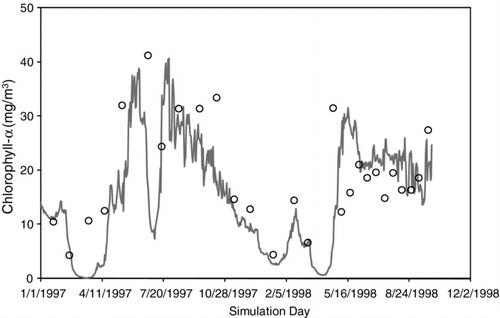
Figure 11 Comparison between observed (open circles) and simulated (solid line) PO4-P (mg/L) at 1 m for collections dates in 1997–1998 near the center of Waco Lake.
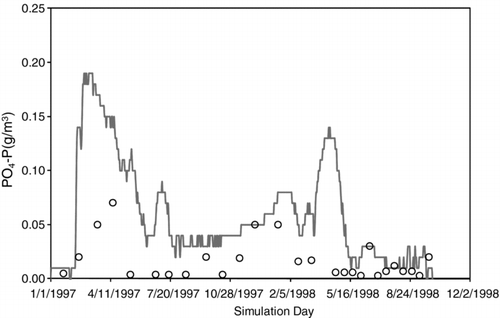
Figure 12 Comparison between observed (open circles) and simulated (solid line) NO2+NO3-N (mg/L) at 1 m for collections dates in 1997–1998.
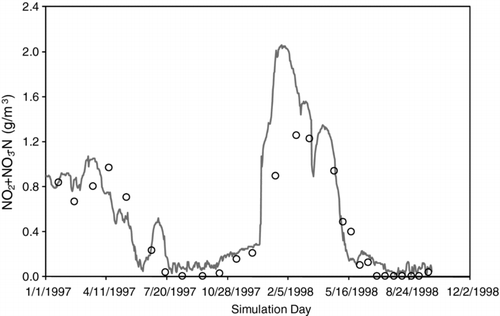
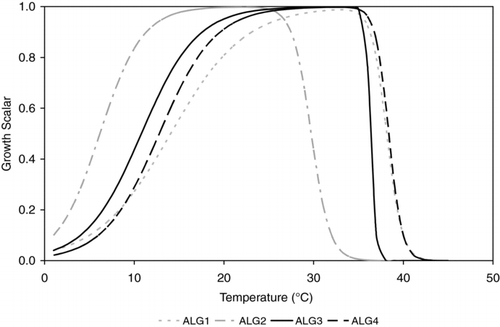
Figure 13 Temperature growth scalars for the four algal groups represented in the CE-Qual-W2 simulations for Waco Lake.