Figures & data
Figure 1 Sampling locations in Lake Mead, October 2008 and March 2009. Black lines represent benthic transects. Transect 1 in Las Vegas Bay (LVB), Transect 2 in Boulder Basin (BB) at Horsepower Cove and Transect 3 in Overton Arm (OA). Triangles represent sites of veliger tows: Station LVB4.15 in LVB, CR351.7 in BB, VR6.0 in OA. Map modified from Rosen and Van Metre (2009).
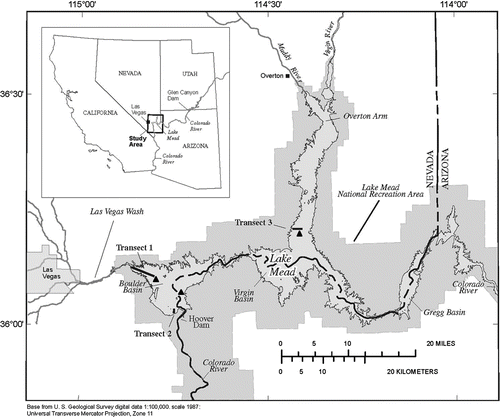
Figure 2 Simpson diversity index as a function of Dreissena bugensis density in (a) Las Vegas Bay (LVB; Coeff. 1.2E-04, R2= 0.05, p = 0.180); (b) Boulder Basin (BB; Coeff. −2.6E-05, R2= 0.10, p = 0.008); and (c) Overton Arm (OA; Coeff −3.2E-05, R2= 0.07, p = 0.004). “x” represents >75% of sediment sample <500 μm, Filled circle represents >75% of sediment sample >500 μm.
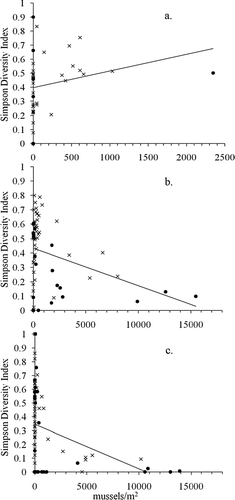
Figure 3 Changes in overall Lake Mead macroinvertebrate abundances between 1986 and 2008 the medium depth zone. (a) Relative temporal comparison of densities by depth distribution of Chironomidae; (b) Corbicula fluminea; (c) Oligocheatae; and (d) other taxa.
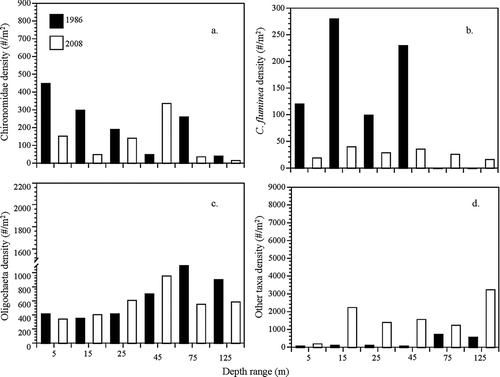
Figure 4 Dreissena bugensis size class and density distribution by depth and by basin, October 2008 and March 2009. Each individual mussel is represented by a circle, and the average quagga mussel size class by depth is represented by the solid black locally weighted polynomial regression (LOESS) line. Dotted lines indicate recorded water temperatures (C) by depth in October 2008. Mixed water conditions present during March 2009.
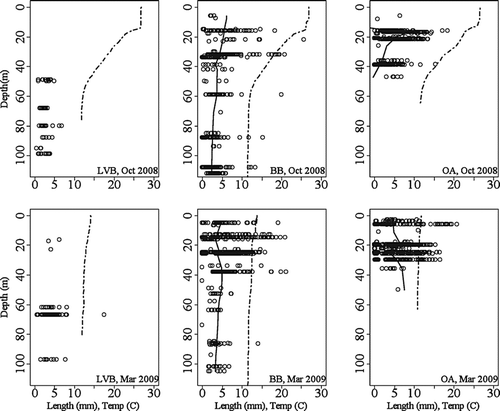
Figure 5 Dreissena bugensis size class distribution in (a and b) Las Vegas Bay; (c and d) Boulder Bay; (e and f) Overton Arm October 2008–March 2009. ML = median length (mm), AD = average density (mussels/m2), N = total abundance.
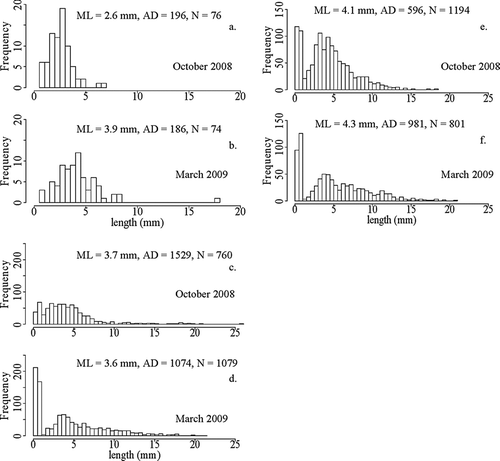
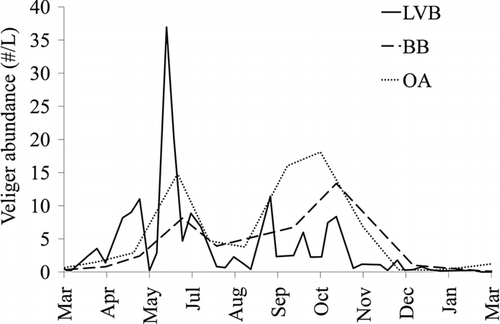
Figure 6 Veliger counts in Las Vegas Bay (LVB), Overton Arm (OA) and Boulder Bay (BB) March 2008–March 2009.