Figures & data
Figure 1 Lake Mead sampling locations, March 2007–March 2008 for zooplankton (black circles), fish electro-shocking routes (solid black lines), and benthic invertebrates (every 5 m along the dashed lines) in Las Vegas Bay and Overton Arm. Stars indicate locations for comparisons between historical (1980s) and contemporary (2007–2008) benthic invertebrate sampling locations to determine potential alterations after quagga establishment. (Base map from US Geological Survey digital data. 1:100,000 scale. 1987: Universal Transverse Mercator Projection, Zone 11).
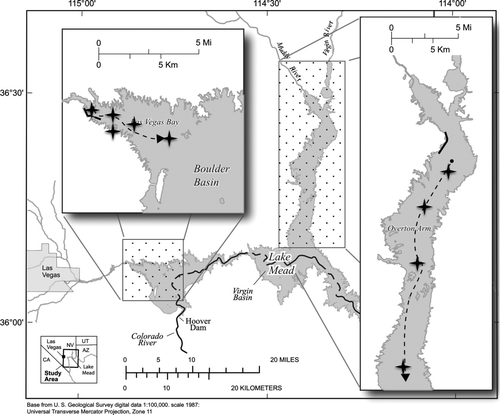
Table 1 Number of fish per species collected in each location (Las Vegas Bay [LVB] and Overton Arm [OVA]) and total number of fish caught over the entire study. Please note no sampling occurred in OVA in March 2007.
Table 2 Comparison of historical (1980s) and contemporary (2008–2009) benthic invertebrate densities by season (October 2008 to late summer, and March 2009 to late spring/early summer) after quagga mussel establishment. A one-way ANOVA using a Tukey's HSD test was used to compare mean densities of invertebrates collected during the 2 time periods.
Figure 2 Benthic invertebrate biomass in (a) Las Vegas Bay in March and November 2007 and (b) Overton Arm in November 2007. Solid lines indicate November mean benthic biomass and dotted line (in 3a only) indicates March mean benthic biomass. Please note differences in y-axis.
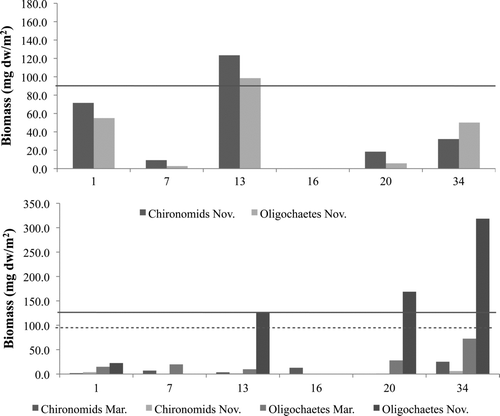
Figure 3 Diet analysis (percentage of dry weight) for bluegill, carp, and largemouth bass in Las Vegas Bay and Overton Arm collected in 2007 and 2008.
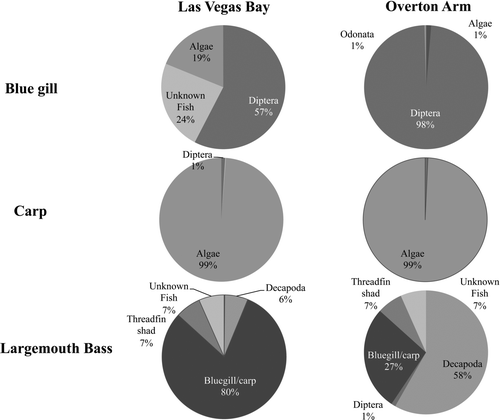
Figure 4 Stable carbon and nitrogen isotope values (mean ± SE) for biota in a) Las Vegas Bay and b) Overton Arm. B = bluegill, C = carp; CC = channel catfish; GS = green sunfish, LB = largemouth bass, SB = striped bass, TS = threadfin shad, Z = zooplankton, BI = benethic invertebrate. Dotted lines represent the pelagic and littoral-benthic end-members for each basin.
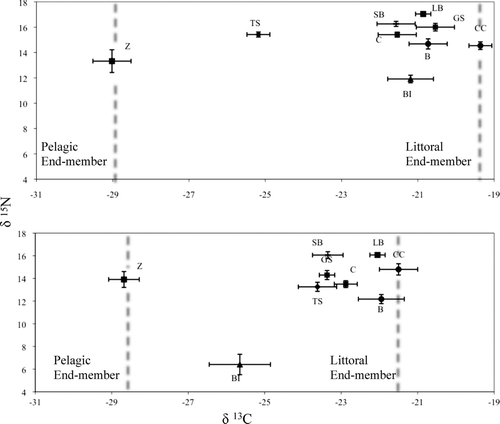
Table 3 Stable carbon and nitrogen isotope values of zooplankton, benthic invertebrates and fish from Las Vegas Bay and Overton Arm basins collected in 2007–2008. The taxa reliance on benthic carbon resources was determined from a 2 end-member mixing model.
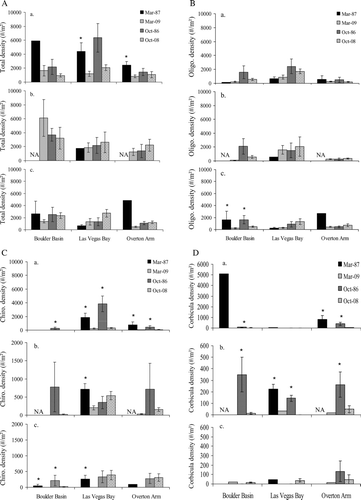
Figure 5 Comparison of historical (1980's) and contemporary (2007–2008) benthic invertebrate densities in three basins by depth (0–20, 21–40, >40 m) where a) is a comparison of total invertebrate density b) oligochaeta density c) chironomidae density and d) Corbicula density. A one-way ANOVA using a Tukey's HSD test was used to compare mean densities between time periods in each basin. Asterisks denote significant differences in mean values. Please note difference in y-axis for chironomidea and Corbicula.