
Figures & data
Table 1. Participant characteristics (N = 3,679).
Figure 1. Depressive symptoms among graduate students.
(a) Prevalence of students scoring at the cutoff point for risk for of having clinical depression and a severe depressive episode for master’s and doctoral students; (b) Zero-order correlations between depressive and both positive and negative factors; (c) Standardized beta weights from regression analyses showing that the associations between negative factors and depressive symptoms are attenuated when positive factors are included in the model.
Note: All betas are greater than zero at p < .001. Analyses included gender, ethnicity, international student status, marital/partnership status, and pursuing a Ph.D. (vs. Master’s) as covariates.
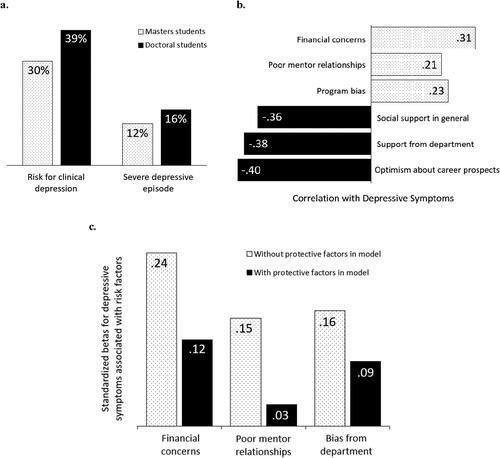
Table 2. Descriptive statistics for depressive symptoms and correlated risk and protective factors.
Table 3. Hierarchical multiple regression analysis predicting depressive symptoms (N = 3,679).