
Figures & data
Table 1. Distribution of the Perceived Stress Scale (PSS-4) by main student demographic characteristics.
Figure 1. Distribution of the 4-point perceived stress scale.
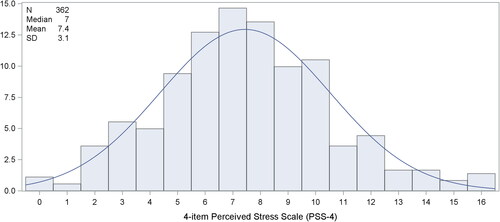
Figure 2. Distribution of the 4-point perceived stress score by sex, quality of sleep and satisfaction with life.
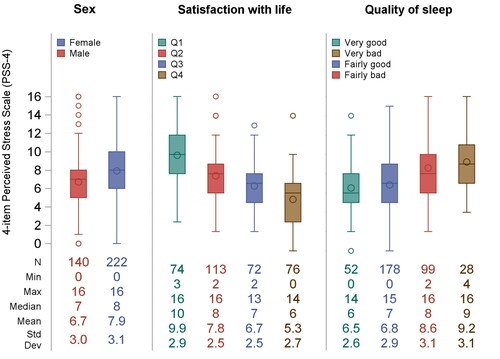
Table 2. Factors associated with elevated perceived stress at univariate analysis.
Table 3. Factors associated with elevated perceived stress at multivariable analysis.
Supplemental material
Supplemental Material
Download MS Word (63.1 KB)Data availability statement
The data that support the findings of this study are available on request from the corresponding author. The data are not publicly available due to ethical restrictions; they contain information that could compromise the privacy of research participants.