Figures & data
Table 1 General characteristics of participants (n = 524).
Table 2 Dietary intake per day by body fat percentage category.
Table 3 Dietary intake per day by self-reported race.
Table 4 Sugar intake, dietary fiber intake, and glycemic load in relation to overfat/obese status.
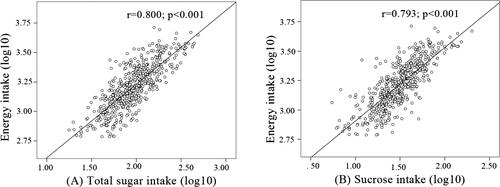
Figure 1 The correlation between energy intake and total sugar (A) and sucrose intake (B) over the past year among young adults.