
Figures & data
Figure 1 Stationarity and ergodicity sufficiency regions for the normal distribution and different scaling choices S(f) = (ℐt(f))−a for a ∈ {0, 1/2, 1}. The two panels contain different regions obtained by parameterizing the matrix roots h(f) with ψ(ρ) = kψarcsin (ρ). Panel (a) contains the results for the symmetric matrix root (kψ = 1/2), and panel (b) corresponds to the Cholesky decomposition (kψ = 1).
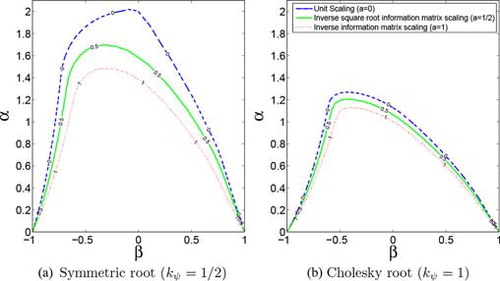
Figure 2 Empirical results. Panel (a) shows 60-day rolling correlations and the filtered correlations between the FTSE 100 (U.K.) and Athex Composite (Greece) equity index returns. The right panel puts the empirical estimates obtained by unconstrained estimation into the zoomed stationarity and ergodicity region perspective.
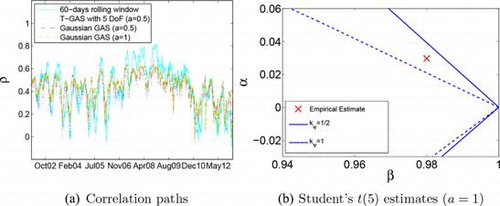
Table 1 Estimation results.
Supplemental material