
Figures & data
Figure 1. Simulated variance processes (blue lines), posterior means (red lines), and 90% highest posterior density intervals (green lines).
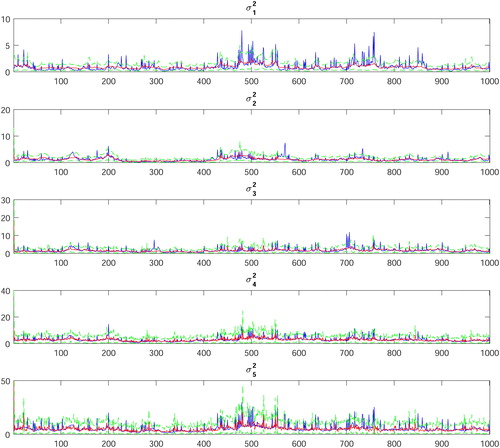
Figure 2. Simulated correlation processes (blue lines), posterior means (red lines), and 90% highest posterior density intervals (green lines).
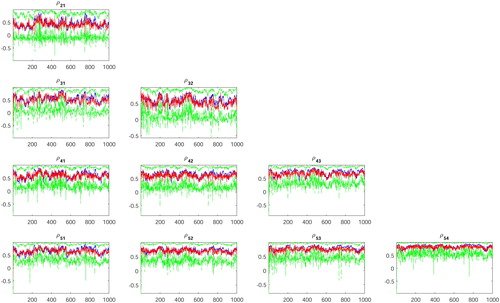
Table 1. Parameter values, posterior means, 90% highest posterior density intervals.
Figure 3. Index values and daily returns (in %).
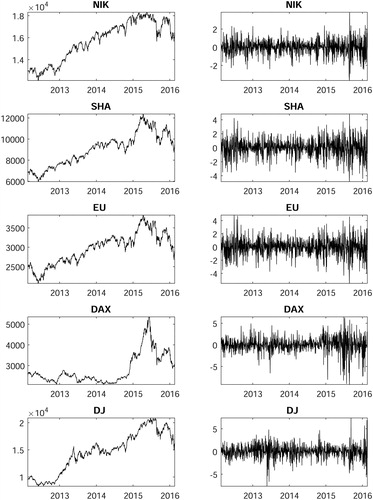
Table 2. Descriptive statistics of daily returns (in %).
Table 3. Posterior means and standard deviations (in parentheses).
Figure 4. In-sample correlations: posterior means plus 50% and 90% highest posterior density intervals.
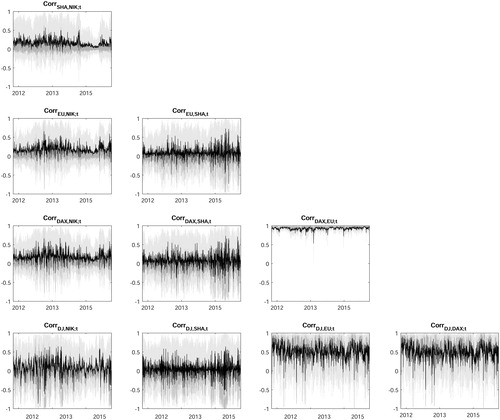
Figure 5. Sample correlations obtained from a rolling window of size 50 centered around the actual observation with the sample-correlation (horizontal line).
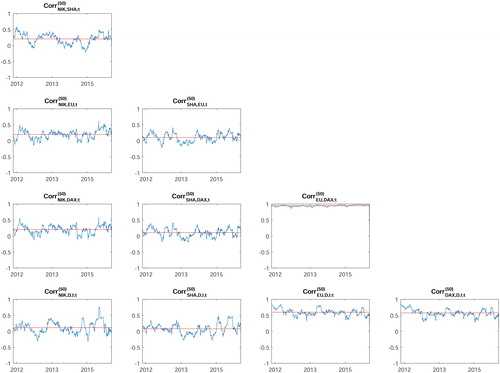
Figure 6. One-step-ahead density forecasts (of the elements of ).
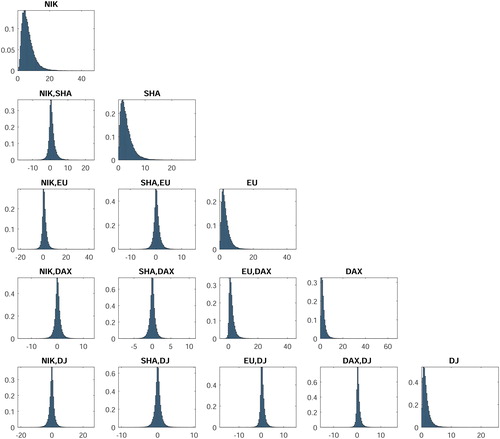
Figure 7. Contour plots of pairwise one-step-ahead density forecasts.
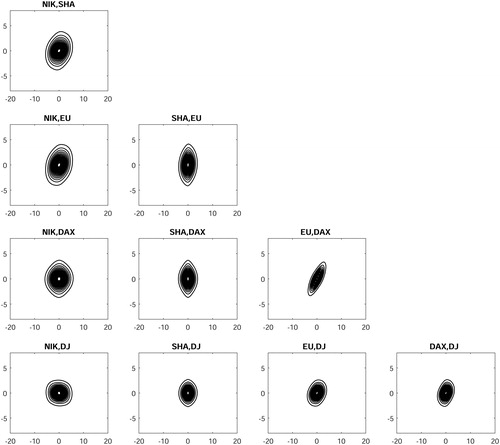
Table 4. Posterior summary of the elements of the one-step-ahead covariance matrix.
Figure 8. Transformed posterior DP precision.
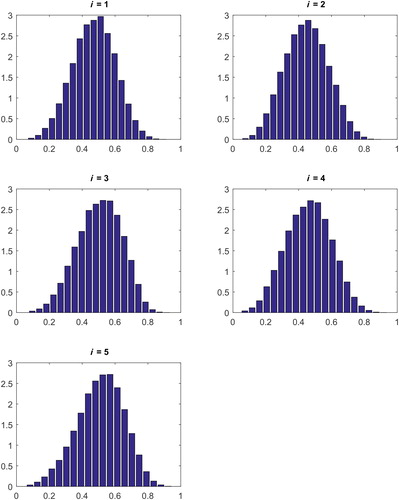
Table 5. Cumulative log predictive likelihoods (CPL).