
Figures & data
Figure 1. Probabilities and
as functions of x for t = 5, p = 20, and
The red plot corresponds to the density of the distribution in the case without misspecification; that is, the standard normal distribution.
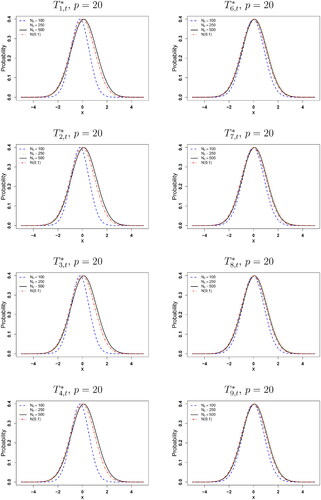
Figure 2. Probabilities and
as functions of x for t = 5, p = 50, and
The red plot corresponds to the density of the distribution in the case without misspecification; that is, the standard normal distribution.
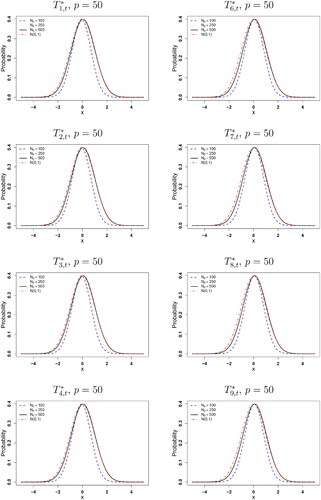
Figure 3. Probabilities and
as functions of x for t = 5, p = 500, and
The red plot corresponds to the density of the distribution in the case without misspecification; that is, the standard normal distribution.
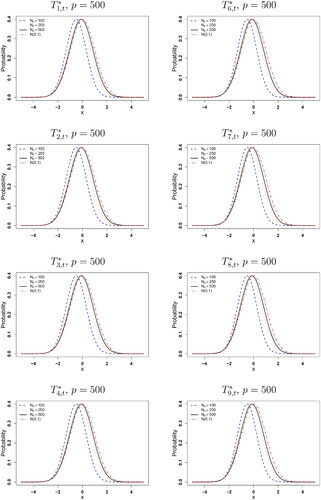
Figure 4. Probabilities and
as functions of x for t = 5, p = 1,000, and
The red plot corresponds to the density of the distribution in the case without misspecification; that is, the standard normal distribution.
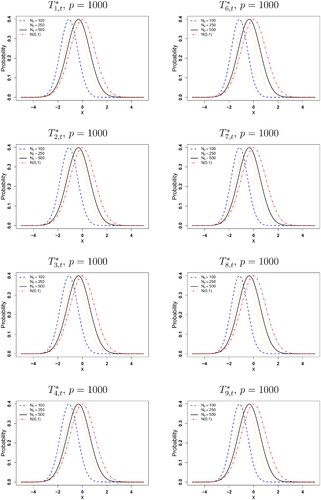
Figure 5. Probabilities (left column) and
(right column) as functions of x for t = 5. We set
with
and
with
The red plot corresponds to the density of the distribution in the case without misspecification; that is, the standard normal distribution.
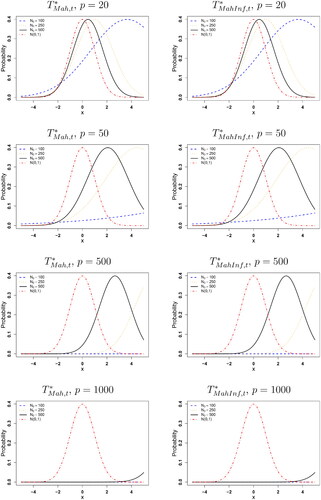
Table 1. ARLs of the and
MEWMA control charts for
when the in-control process is the 20-dimensional VAR(1) process.
Table 2. ARLs of the and
MEWMA control charts for
when the in-control process is the 100-dimensional VAR(1) process.