
Figures & data
Table 1 Demographic and clinical description of study sample (N = 171).
Figure 1. Graphical display of non-disclosure scores according to diagnostic categories.
Note: Box-plots displaying median (Md), inter-quartile range (IQR), upper-and lower 25% of scores; outliers and extreme scores. Psychoactive substances (n = 23) Md = 3.8 (IQR = 23.1); Schizophrenia spectrum disorders (n = 11) = 18.1 (52.0); Bipolar disorder (n = 25) = 3.0 (15.7); Depressive disorders (n = 40) = 4.4 (53.2); Neurotic, stress-related and somatoform disorders (n = 25) = 3.8 (14.7); Emotionally unstable personality disorder (n = 13) = 62.0 (42.2); “Other” disorders (n = 34) = 3.9 (43.8).
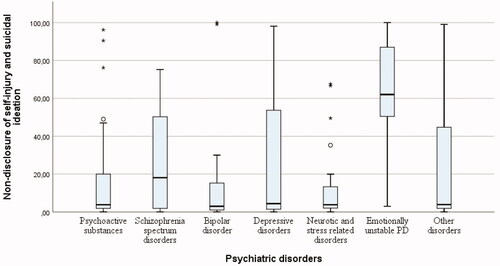
Table 2. Multiple linear regression analysis of patient factors on non-disclosure of suicidal ideation (N = 151).