
Figures & data
Table 1. Descriptive table of demographic variables.
Table 2. Changes in fear of death and subjective well-being.
Figure 1. Relationships between acute subjective effects, and changes in fear of death and subjective well-being measures.
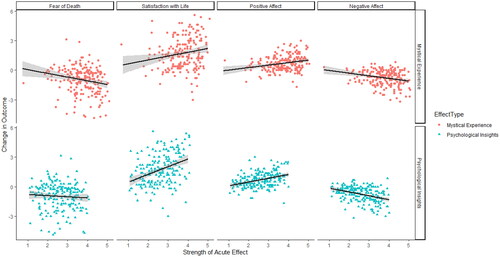
Table 3. Pearson’s bivariate correlations between study variables.
Table 4. Total, direct, and indirect effects of mystical experience and psychological insight.