
Figures & data
Figure 1. PRISMA Diagram reporting the study selection process. PRISMA preferred reporting guidelines for systematic reviews and meta-analysis. From: Page et al. (Citation2021). For more information, visit: http://www.prisma-statement.org/
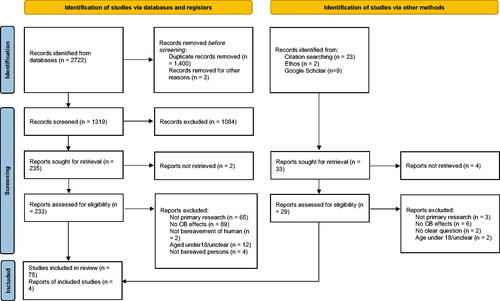
Table 1. Summary of quality assessment of included studies using the MMAT (N = 79).
Supplemental material