Figures & data
Figure 1. The study model.
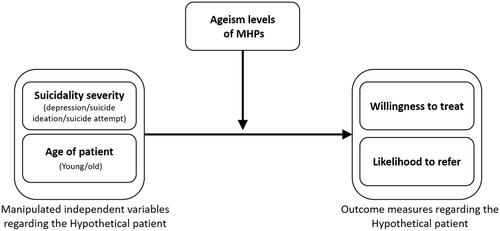
Table 1. Demographic and professional characteristics of the sample (N = 368).
Table 2. Descriptive statistics of study variables (N = 368).
Figure 2. Willingness to treat and the likelihood of refer out a hypothetical patient as a function of the patient’s suicidality severity (depressive/SI/SA) and patient’s age (young/old) (N = 368).
Note. *p <. 05, **p <.01, ***p <.001. SI: Suicide ideation; SA: Suicide attempt.
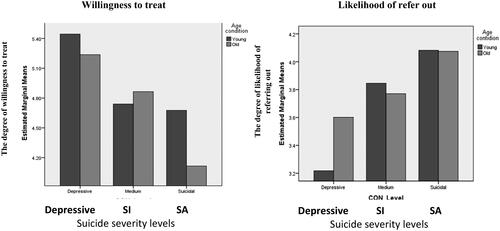
Table 3. Intercorrelations between the study variables and outcome measures of willingness-to-treat and likely-to-refer (N = 368).
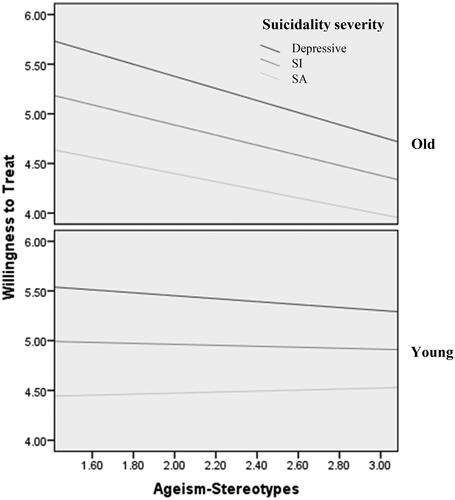
Figure 3. Willingness to treat as a function of therapists’ ageist stereotypes beliefs, moderate by patients’ suicidality severity (N = 368).