
Figures & data
Figure 1. Simplified Directed Acyclic Graph of perceived neighborhood social cohesion and neighborhood participation regarding serious illness, death, and loss.
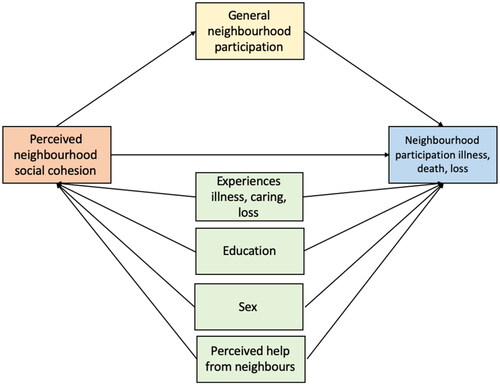
Table 1. Characteristics of the study population per neighborhood.
Table 2. The degree to which citizens in two neighborhoods in Flanders engage in neighborhood participation regarding serious illness, death or loss.
Table 3. Hierarchical linear regression testing the assumed associations for neighborhood participation around serious illness, death, and loss.
Supplemental material
Supplemental Material
Download MS Word (738.4 KB)Data availability
The data set and data syntax can be provided by contacting the corresponding author.