
Figures & data
Table 1. Characteristics of the study population (n = 3033) according to all-cause mortality events.
Table 2. Baseline resting and exercise characteristics of the study population (n = 3033) according to all-cause mortality events.
Figure 1. All-cause and CVD deaths are presented by Cox multivariate proportional hazard regression models according to achieved maximal workload (watts) during maximal exercise testing. (a) shows all-cause mortality in men and (b) in women. (c) shows CVD mortality in men and (d) in women. The cut-off values concerning CVD mortality for men were <125 W (n = 274), 125–162.49 W (n = 441), 162.5–189.12 W (n = 415) and ≥189.12 W (n = 378) and for women <81 W (n = 206), 81–99.99 W (n = 264), 100–112.49 W (n = 285) and ≥112.5 W (n = 311) according to quartiles. The cut-off values for all-cause mortality among men were <125 W (n = 348), 125–161.99 W (n = 485), 162–187.49 W (n = 404) and ≥187.5 W (n = 446) and in women <81.0 W (n = 240), 81–99.99 W (n = 293), 100–112.49 W (n = 304) and ≥112.50 W (n = 319).
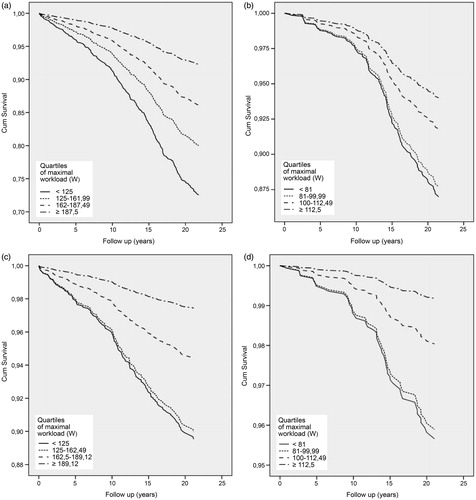
Table 3. Sex-specific adjusted hazard ratios and their 95% CI for the association of exercise capacity during exercise stress test with CVD and all-cause mortality among the study population (n = 3033).