Figures & data
Figure 1. Preferred reporting items for systematic reviews and meta-analyses (PRISMA) flow diagram.
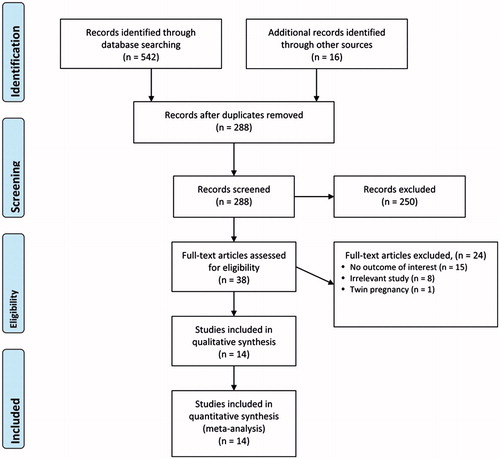
Table 1. Characteristics of studies included in the meta-analysis.
Table 2. Amniotic fluid IL-6, MMP-8, and glucose levels.
Figure 2. Meta-analysis for interleukin-6 (IL-6) (A), matrix metalloproteinase-8 (MMP-8) (B), and glucose (C) between preterm and term delivery groups. Abbreviations: SE: standard error; CI: confidence interval, lower limit and upper limit; lower limit and upper limit of 95% CI, respectively.
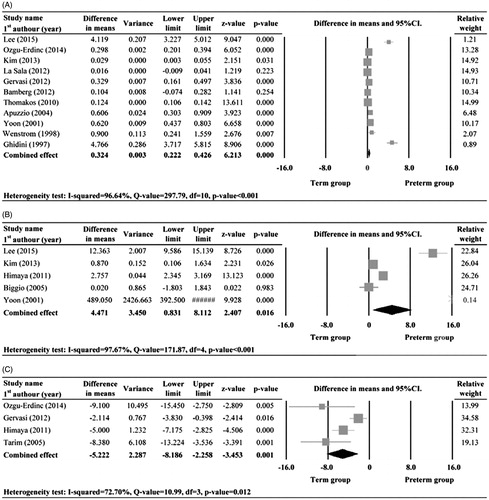
Figure 3. Sensitivity-analysis for IL-6 (A), MMP-8 (B), and glucose (C) between preterm and term delivery groups. Abbreviations: SE: standard error; CI: confidence interval, lower limit and upper limit; lower limit and upper limit of 95% CI, respectively.
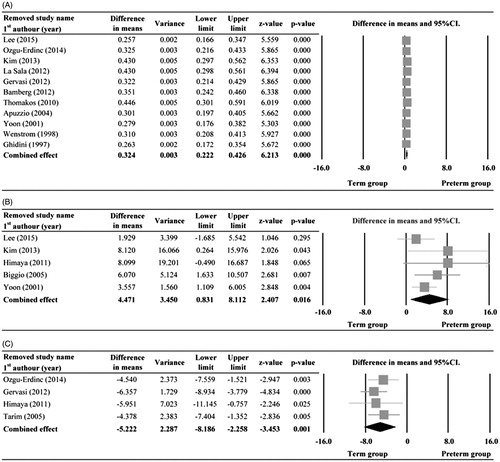
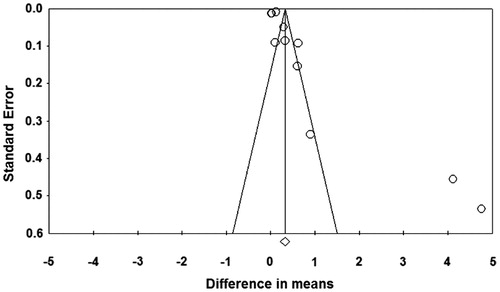
Figure 4. Funnel plot for publication bias for interleukin-6 (IL-6). Egger’s test: t = 3.03; one-tailed p = 0.007.