Figures & data
Table 1. Baseline characteristics stratified by sex.
Table 2. SDNN across quartiles of inflammatory biomarkers.
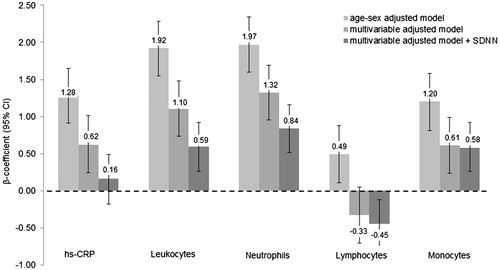
Figure 1. Relationship between SDNN and inflammatory biomarkers. Data are presented as β-coefficients (95% confidence intervals) per 1 standard deviation increase. SDNN: standard deviation of all normal RR intervals; Hs-CRP: high-sensitivity C-reactive protein. Model 1 was adjusted for age, sex. Model 2 was additionally adjusted for body mass index, smoking status, educational status, alcohol consumption, fruit and vegetable consumption, fish consumption, systolic blood pressure, prediabetes, physical activity, low- and high-density lipoprotein cholesterol, triglycerides, endothelin-1, estimated glomerular filtration rate, family history of cardiovascular disease and body fat. Model 3 was additionally adjusted for resting heart rate. Model 4 was additionally adjusted for 24-h heart rate instead of resting HR. n = 2096.
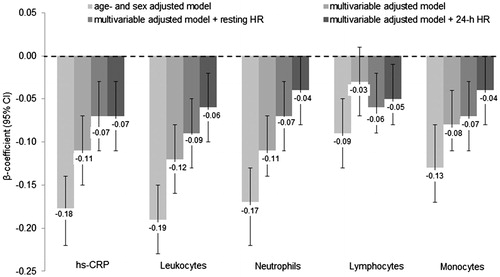
Figure 2. Relationship between normalized HF and inflammatory biomarkers. Data are presented as β-coefficients (95% confidence intervals) per 1 standard deviation increase. HF: high frequency; Hs-CRP: high-sensitivity C-reactive protein. Model 1 was adjusted for age, sex. Model 2 was additionally adjusted for body mass index, smoking status, educational status, alcohol consumption, fruit and vegetable consumption, fish consumption, systolic blood pressure, prediabetes, physical activity, low- and high-density lipoprotein cholesterol, triglycerides, endothelin-1, estimated glomerular filtration rate, family history of cardiovascular disease and body fat. Model 3 was additionally adjusted for resting heart rate. Model 4 was additionally adjusted for 24-h heart rate instead of resting HR. n = 2096.
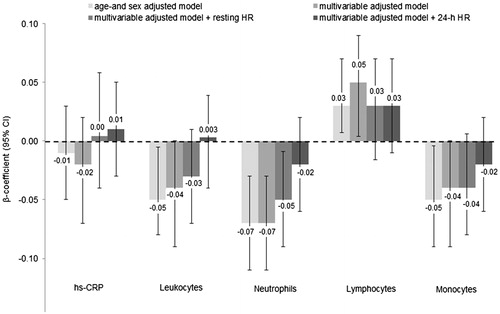
Figure 3. Relationship between normalized LF and inflammatory biomarkers. Data are presented as β-coefficients (95% confidence intervals) per 1 standard deviation increase. LF: low frequency; Hs-CRP: high-sensitivity C-reactive protein. Model 1 was adjusted for age, sex. Model 2 was additionally adjusted for body mass index, smoking status, educational status, alcohol consumption, fruit and vegetable consumption, fish consumption, systolic blood pressure, prediabetes, physical activity, low- and high-density lipoprotein cholesterol, triglycerides, endothelin-1, estimated glomerular filtration rate, family history of cardiovascular disease and body fat. Model 3 was additionally adjusted for resting heart rate. Model 4 was additionally adjusted for 24-h heart rate instead of resting HR. n = 2096.
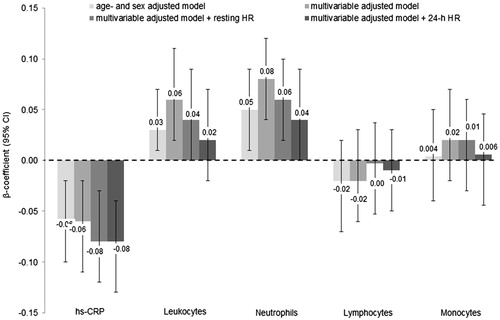
Figure 4. Relationship between ambulatory heart rate and inflammatory biomarkers. Data are presented as β-coefficients (95% confidence intervals) per 1 standard deviation increase. Hs-CRP: high-sensitivity C-reactive protein. Model 1 was adjusted for age, sex. Model 2 was additionally adjusted for body mass index, smoking status, educational status, alcohol consumption, fruit and vegetable consumption, fish consumption, systolic blood pressure, prediabetes, physical activity, low- and high-density lipoprotein cholesterol, triglycerides, endothelin-1, estimated glomerular filtration rate, family history of cardiovascular disease and body fat. Model 3 was additionally adjusted for the standard deviation of all normal RR intervals. n = 2096.