
Figures & data
Table 1. Patient characteristics.
Figure 1. (A) Kaplan–Meier curves of OS, (B) Cumulative incidence risk of developing solid malignancies, and (C) Kaplan–Meier curves of time to anti-leukemic treatment; subgrouped according to baseline CRP levels of <0.4 mg/dL and ≥0.4 mg/dL.
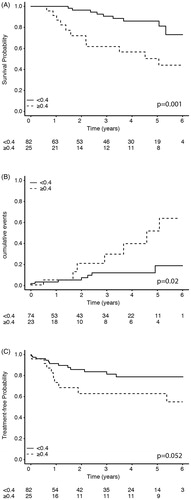
Figure 2. The cumulative incidence risk of developing non-hematological cancers in patients with CLL and apparently healthy individuals, stratified by serum CRP levels (<0.4 mg/dL and ≥0.4 mg/dL).
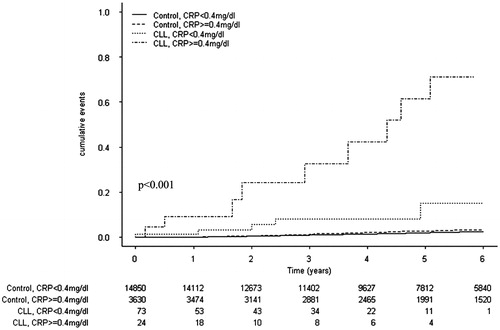
Table 2. Univariate and multivariate analyses of OS, second cancers, and treatment in patients with CLL.
Table 3. Multivariate Cox regression analysis, time to second cancer diagnosis.