Figures & data
Table 1. Baseline characteristics: male vs. female.
Table 2. Lesion characteristics: male vs. female.
Figure 1. Survival analysis: Kaplan–Meier curves for cardiovascular death (A), myocardial infarction (B), target vessel revascularization (C) and major adverse cardiovascular event (D) at three years comparing males and females.
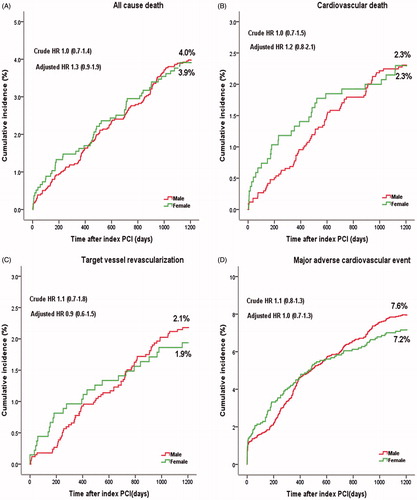
Figure 2. Survival analysis within six months and landmark analysis beyond six months for all-cause death (A), cardiovascular death (B), target vessel revascularization (C) and major adverse cardiovascular event (D).
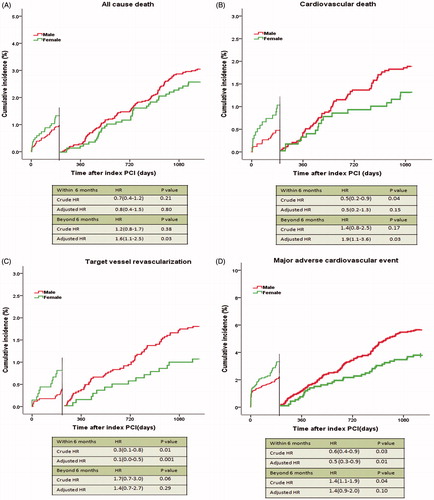
Table 3. Clinical outcomes comparing male and female for the entire three years follow-up, within six months and beyond six months.
Figure 3. Forrest plots for adjusted hazard ratio (HR) of male relative to female for adverse events at entire three years follow-up, within six months and beyond six months. CI: confidence interval; MI: myocardial infarction; TVR: target vessel revascularization; MACE: major adverse cardiovascular event.
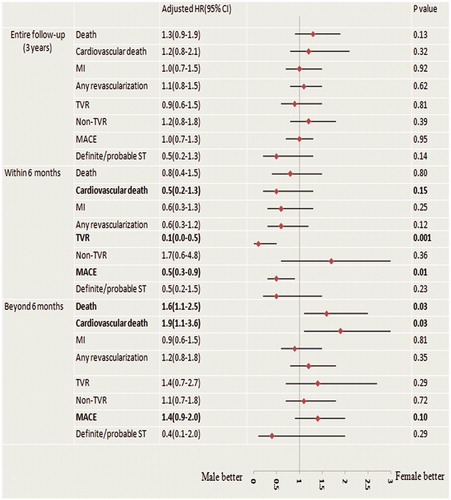
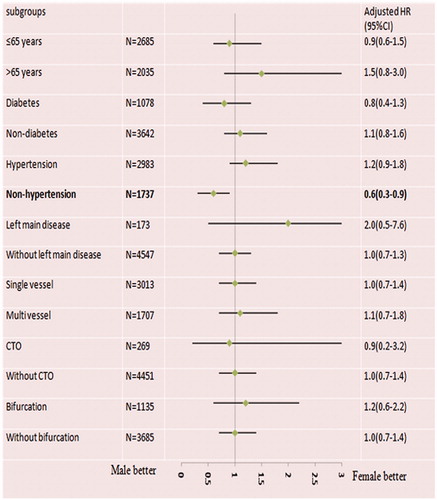
Figure 4. Adjusted hazard ration (HR) of male versus female on major adverse cardiovascular events (MACE) at three years in subgroups. CI: confidence interval; CTO: chronic total occlusion.