
Figures & data
Figure 1. Flow diagram of the study. Abbreviation: eGFR: estimated glomerular filtration rate; UPCR: urine protein-to-creatinine ratio.
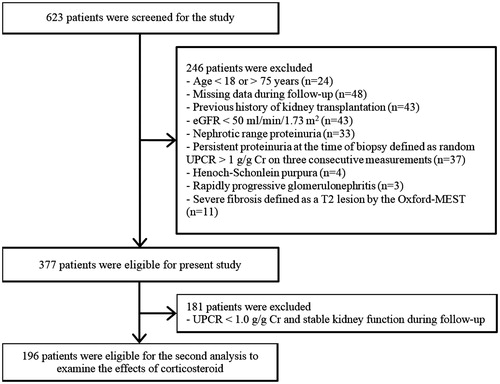
Table 1. Baseline characteristics according to the Oxford classification (M and E, n = 377).
Table 2. Baseline characteristics according to the Oxford classification (S and T, n = 377).
Figure 2. Kaplan–Meier plots for the development of persistent proteinuria according to the Oxford-MEST.
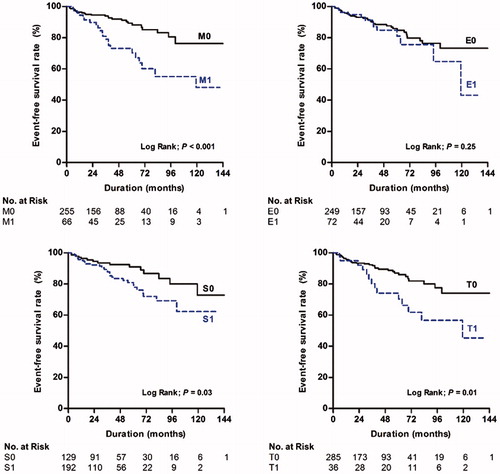
Figure 3. Time course of UPCR according to Oxford classification. Each point was demonstrated as the mean values with standard errors of UPCR on every 6-month follow-up. Abbreviation: UPCR: urine protein-to-creatinine ratio.
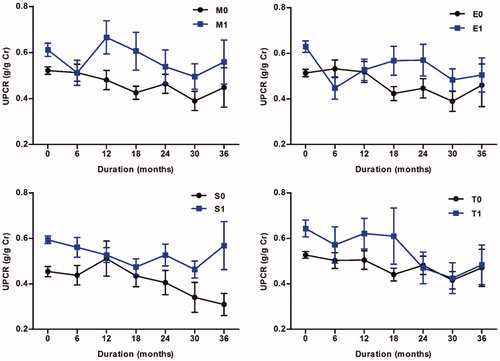
Table 3. Cox regression model with time-dependent covariates for the association of Oxford classification with development of persistent proteinuria (n = 377).
Figure 4. Receiver operating characteristics curve for the development of persistent proteinuria by the Oxford-MEST.
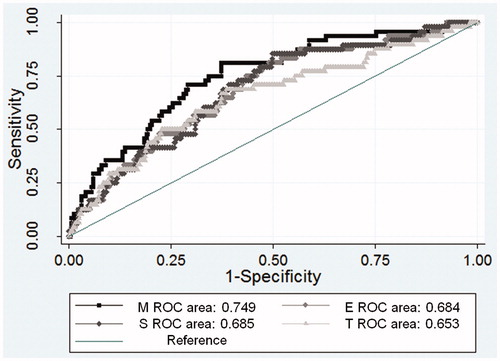
Table 4. C-Statistics for prediction of the development of persistent proteinuria using multivariate Cox’s regression models.
Table 5. Cox proportional hazard regression analysis for the association of Oxford classification with a 30% decline in eGFR (n = 377).
Figure 5. The changes in UPCR after 6 months with (A) and without (B) glucocorticoids treatment. Abbreviation: UPCR: urine protein-to-creatinine ratio.
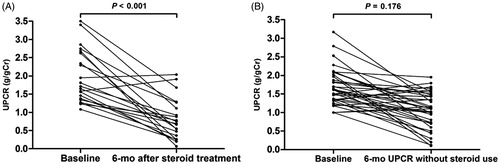
Figure 6. A Kaplan–Meier plot and eGFR decline rate in the matched cohort of glucocorticoid users versus nonusers with M1 (A). The mean with standard errors were used in time course of eGFR (B) and UPCR figures (C). Abbreviation: eGFR: estimated glomerular filtration rate; UPCR: urine protein-to-creatinine ratio.
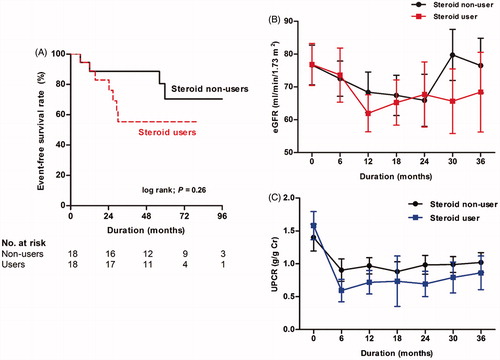
Table 6. Baseline characteristics in the unmatched and matched cohort according to glucocorticoids treatment.
Table 7. Cox proportional hazard analysis for the effect of glucocorticoid treatment on a 30% decline in eGFR with the unmatched and matched M1 cohort.