807
Views
16
CrossRef citations to date
0
Altmetric
Original Article

Association of sleep-disordered breathing with diabetes-associated kidney disease

, , , , , & show all
Pages 487-495 | Received 11 Dec 2016, Accepted 06 Mar 2017, Published online: 27 Mar 2017

Figures & data

Figure 1. Study flow chart.

Figure 1. Study flow chart.

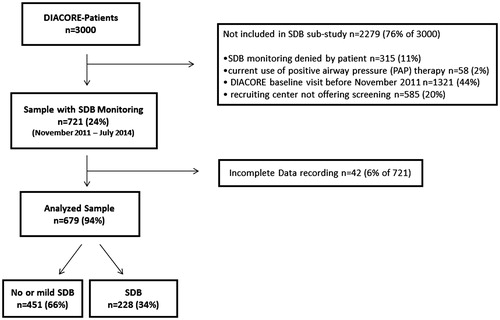
Table 1. Clinical characteristics of the 679 analysed subjects at the DIACORE baseline visit.

Table 2. Clinical and SDB parameters of the 679 analysed subjects at the DIACORE baseline visit by SDB class.

Figure 2. Kidney function measured as eGFR (A and C) and albuminuria measured as UACR (B and D, analysed on ln-scale) across SDB categories in 679 subjects at the DIACORE baseline visit. Bars indicate mean values by group and error bars indicate 95% confidence intervals. ANOVA p value was used for overall association and Bonferroni post-hoc test for pairwise comparisons (A and B). A generalized linear model (Analysis of covariance, ANCOVA) was used to compute adjusted mean eGFR and UACR for the categories of SDB (C and D, adjusted for age, BMI, systolic blood pressure, duration of DM2, HbA1c and AHI). eGFR: estimated glomerular filtration rate, UACR: urinary albumin-creatinine-ratio, SDB: sleep-disordered breathing.

Figure 2. Kidney function measured as eGFR (A and C) and albuminuria measured as UACR (B and D, analysed on ln-scale) across SDB categories in 679 subjects at the DIACORE baseline visit. Bars indicate mean values by group and error bars indicate 95% confidence intervals. ANOVA p value was used for overall association and Bonferroni post-hoc test for pairwise comparisons (A and B). A generalized linear model (Analysis of covariance, ANCOVA) was used to compute adjusted mean eGFR and UACR for the categories of SDB (C and D, adjusted for age, BMI, systolic blood pressure, duration of DM2, HbA1c and AHI). eGFR: estimated glomerular filtration rate, UACR: urinary albumin-creatinine-ratio, SDB: sleep-disordered breathing.

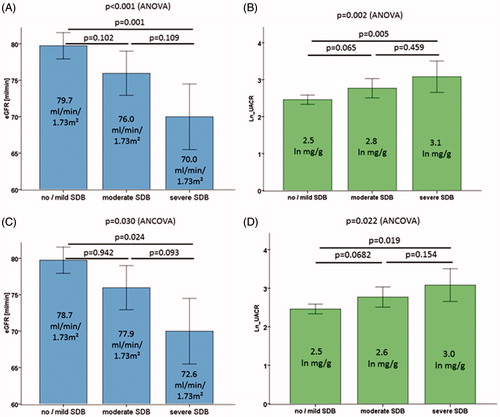
Table 3. Relationship between SDB and DKD in the total sample and by sex at the DIACORE baseline visit.

Table 4. Modulators for eGFR in total sample, in 412 men and in 267 women.

Table 5. Modulators for ln UACR in total sample, in 412 men and in 267 women.

Table 6. Cross-sectional studies looking for association between DKD and SDB.

Reprints and Corporate Permissions

Please note: Selecting permissions does not provide access to the full text of the article, please see our help page How do I view content?

To request a reprint or corporate permissions for this article, please click on the relevant link below:

Academic Permissions

Please note: Selecting permissions does not provide access to the full text of the article, please see our help page How do I view content?

Obtain permissions instantly via Rightslink by clicking on the button below:

If you are unable to obtain permissions via Rightslink, please complete and submit this Permissions form. For more information, please visit our Permissions help page.