
Figures & data
Figure 1. The flow chart of study population in the present study.
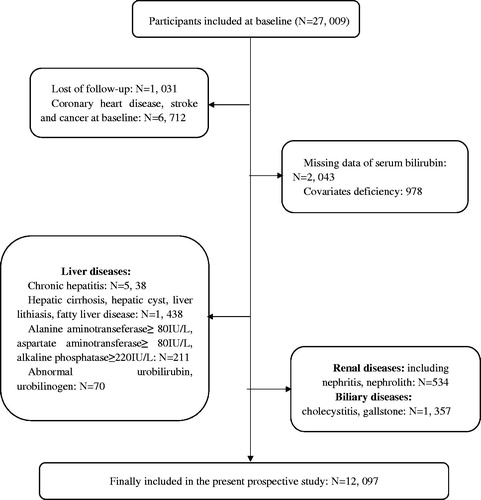
Table 1. Baseline characteristics of participants across quintiles of direct bilirubin levels.Table Footnotea
Figure 2. Multivariable adjusted restricted cubic splines for the relationship between DBIL (a), IBIL (b), TBIL (c) levels and risk for CHD incidence in a Cox proportional hazard model. The model was adjusted for age, sex, body mass index, smoking, drinking, physical activity, education levels and family history of CHD, hypertension, hyperlipidemia, diabetes, ALT, AST and ALP. The solid lines and dashed lines indicates the adjusted hazard ratios (HR) and 95% confidence interval (CI), respectively. DBIL: direct bilirubin; IBIL: indirect bilirubin; TBIL: total bilirubin; ALT: alanine aminotransferase; AST: aspartate aminotransferase; ALP: alkaline phosphatase; CHD: coronary heart disease.
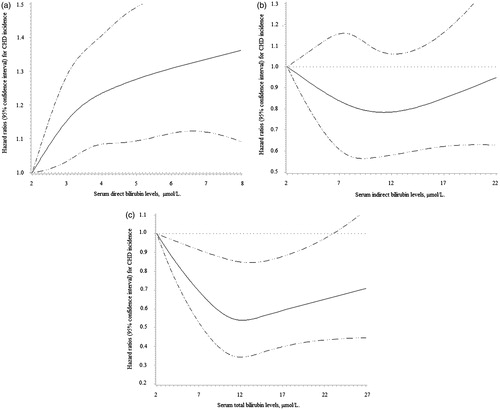
Table 2. Hazard ratios (95% CI) for CHD incidence according to three types of serum bilirubin levels.
Table 3 Associations of CHD incidence with serum direct bilirubin levels stratified by baseline characteristicsTable Footnotea.