
Figures & data
Table 1. Clinical characteristics of the study participants during the study.Table Footnotea
Figure 1. MMP-8 and MMP-8/TIMP-1 concentrations in saliva and serum at baseline and after follow-up in the study groups. MMP-8 levels in (A) serum and (B) saliva and MMP-8/TIMP-1 ratios in (C) serum and (D) saliva of patients with early rheumatoid arthritis (ERA), chronic rheumatoid arthritis (CRA) and healthy control subjects (controls). The boxes denote the interquartile range (IQR; 25th–75th percentiles) and the horizontal lines within the boxes denote the medians (50th percentile). Outliers (values more than 1.5 times IQR from the median) are shown as circles and extreme values (values more than three times IQR from the median) are shown as asterisks, with the minima and maxima of the remaining values shown as whiskers. Statistically significant p values (<.05) are shown corresponding to Mann-Whitney test (post hoc Kruskal-Wallis test) comparing ERA, CRA and the controls groups or corresponding to Wilcoxon test comparing baseline and follow-up values.
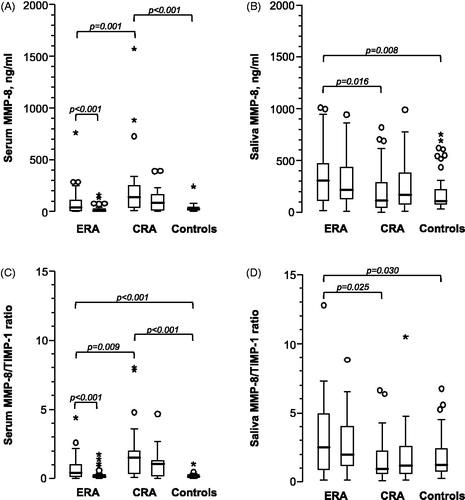
Table 2. MMP-8, TIMP-1, MMP-8/TIMP-1 ratio and IL-6 concentrations in saliva and serum from the study participants during the study.Table Footnotea,Table Footnoteb
Figure 2. Il-6 concentrations in saliva and serum at baseline and after follow-up in the study groups. Interleukin-6 (IL-6) levels in (A) serum and (B) saliva of patients with early rheumatoid arthritis (ERA), chronic rheumatoid arthritis (CRA) and healthy control subjects (controls). The boxes denote the interquartile range (IQR; 25th–75th percentiles) and the horizontal lines within the boxes denote the medians (50th percentile). Outliers (values more than 1.5 times IQR from the median) are shown as circles and extreme values (values more than three times IQR from the median) are shown as asterisks, with the minima and maxima of the remaining values shown as whiskers. Statistically significant p values (<.05) are shown corresponding to Mann-Whitney test (post hoc Kruskal-Wallis test) comparing ERA, CRA and the controls groups or corresponding to Wilcoxon test comparing baseline and follow-up value.
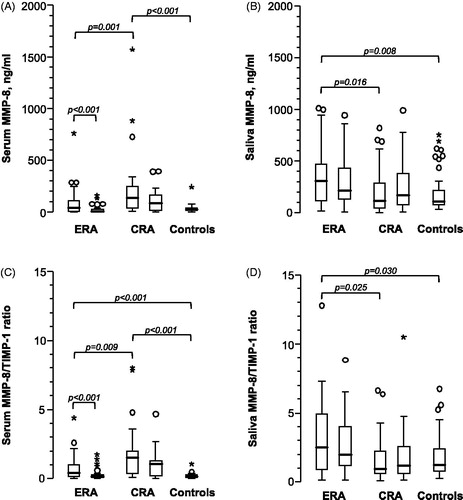
Table 3. Correlations of serum MMP-8, TIMP-1, IL-6 and periodontal and rheumatological parameters during the study.Table Footnotea,Table Footnoteb
Table 4. Correlations of serum and salivary MMP-8/TIMP-1 ratio and periodontal and rheumatological parameters during the study.Table Footnotea,Table Footnoteb
Table 5. Correlations of salivary MMP-8, TIMP-1, IL-6 and periodontal and rheumatological parameters during the study.Table Footnotea,Table Footnoteb