Figures & data
Table 1. Comparison TZD treatment and non-tzd treatment groups of patients with newly-diagnosed DM with respect to characteristics in demographics and comorbidities (n = 38,521).
Figure 1. Parkinson’s disease-free survival rates for thiazolidinedione treatment and non-thiazolidinedione treatment groups of patients with newly-diagnosed diabetes mellitus.
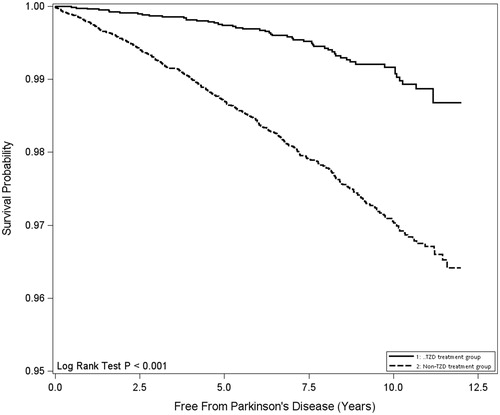
Table 2. Crude and adjusted hazard ratios for parkinson’s disease among DM patients with TZD treatment and non-TZD treatment (n = 38,521).
Table 3. Comparison among diabetic patients with treatment of variable doses of TZD with respect to characteristics in demographics and comorbidities, and hazard ratios for parkinson’s disease.
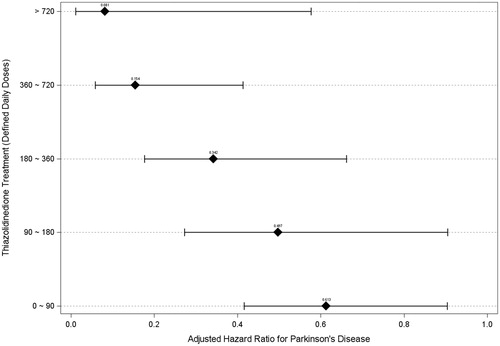
Figure 2. Adjusted hazard ratios for Parkinson’s disease for subgroups treated with different cumulative defined daily doses of thiazolidinedione.