
Figures & data
Figure 1. X-TRA study design. CrCl: creatinine clearance; EOT: end of treatment.
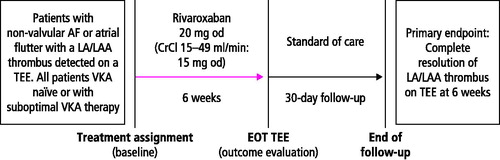
Table 1. Relationship between baseline biomarkers and demographic variables based on multivariate models.
Table 2. Multivariate models of relationships between echocardiograhic characteristics and biomarker levels at baseline.
Figure 2. Boxplots of biomarker levels. Values at baseline and end of treatment (descriptive). The red circles are baseline values and the blue crosses are values for the end of treatment. The median is indicated as a solid horizontal line in bold; “+” indicates the mean; the bottom and top of the box are the first and third quartiles (25th and 75th percentile), therefore 50% of the observations lie within this box and the box length is the interquartile range; the upper and lower whiskers are at the lowest and highest observation if they do not exceed 1.5 times the box length (interquartile range). F1:2: prothrombin fragment 1 + 2; hsCRP: high-sensitivity C-reactive protein; hsIL-6: high-sensitivity interleukin-6; PAI-1: plasminogen activator inhibitor-1; TAT: thrombin–antithrombin complexes; vWF: von Willebrand factor.
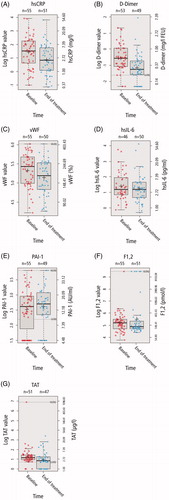
Table 3. Multivariate logistic models of relationships between thrombus outcomes and biomarker baseline levels.