Figures & data
Figure 1. Flow chart of the number of studies identified and included into the meta-analysis.
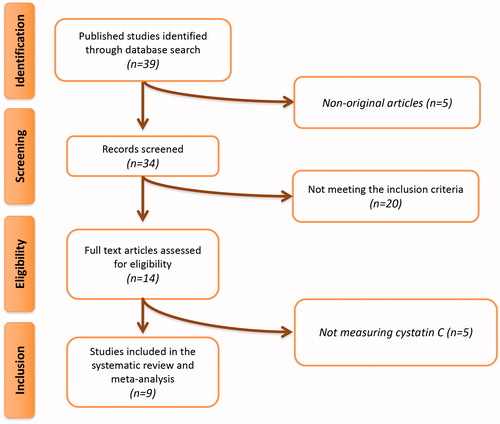
Table 1. Demographic characteristics of the included studies.
Table 2. Quality of bias assessment of the included studies according to the Cochrane guidelines.
Figure 2. Forest plot detailing weighted mean difference and 95% confidence intervals for the impact of fibrates on plasma cystatin C concentrations in single-arm uncontrolled trials. Lower plot shows the results of leave-one-out sensitivity analysis.
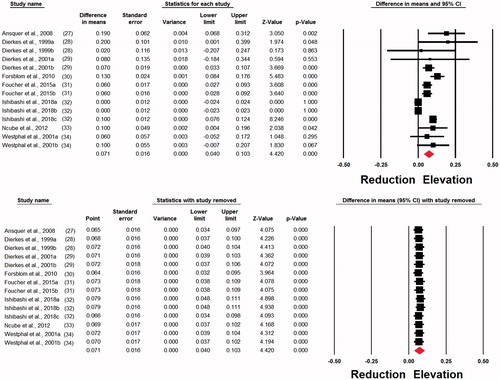
Figure 3. Forest plot detailing weighted mean difference and 95% confidence intervals for the impact of individual fibrates on plasma cystatin C concentrations in single-arm uncontrolled trials. Lower plot shows the results of leave-one-out sensitivity analysis.
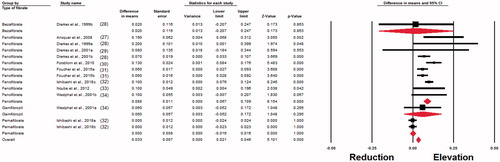
Figure 4. Forest plot detailing weighted mean difference and 95% confidence intervals for the impact of fibrates on plasma cystatin C concentrations in randomized controlled trials. Lower plot shows the results of leave-one-out sensitivity analysis.
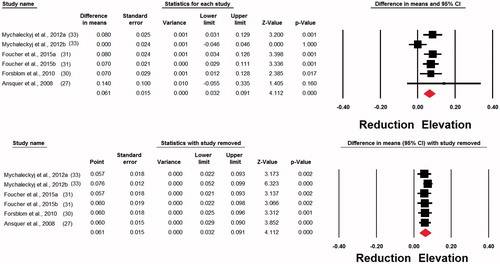
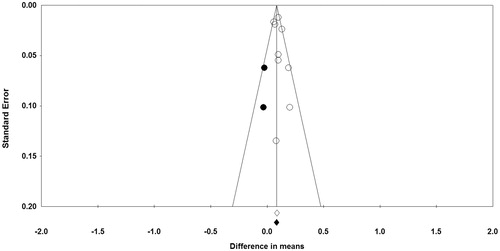
Figure 5. Funnel plot detailing publication bias in the studies reporting the impact of fibrate fibrates on plasma cystatin C concentrations in single-arm uncontrolled trials. Open circles represent observed published studies; closed circles represent imputed unpublished studies.