Figures & data
Table 1. Baseline characteristics of the study sample.
Table 2. Risk of major osteoporotic fracture, impaired mental and physical capacity and comorbidity Mean difference (95% CI).
Table 3. Risk of hip fracture, impaired mental and physical capacity and comorbidity Mean difference (95% CI).
Table 4. Patients with prior osteoporotic fracture and their relationship with impaired mental and physical capacity and comorbidity Mean difference (95% CI).
Table 5. Pearson’s correlation and multivariate regression analysis of FRAX for hip fracture.
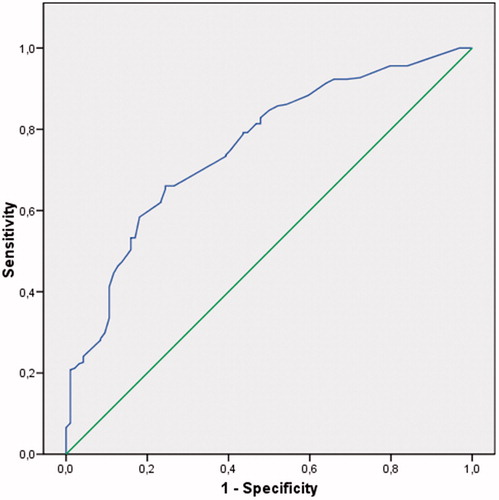
Figure 1. ROC curve. Relationship between the BI/MMSE and hip fracture risk >3.