
Figures & data
Figure 1. Flowchart of study selection. RCT: randomized controlled trial; ESM: electronic supplementary material.
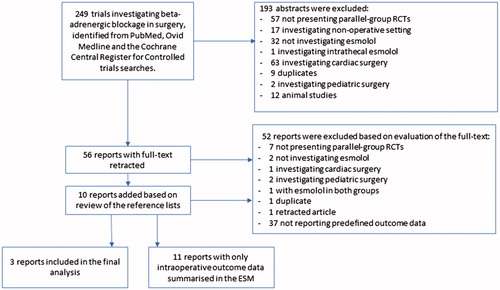
Table 1. Characteristics of the studies included in the Meta-analysis.
Figure 2. (A) Forest plots of the comparisons (panel A) myocardial ischaemia, (panel B) myocardial infarction, (panel C) unstable angina pectoris, and (panel D) a composite of cardiac events. (B) Forest plots of the comparisons (panel A) bradycardia, (panel B) hypotension, and (panel C) all-cause mortality.
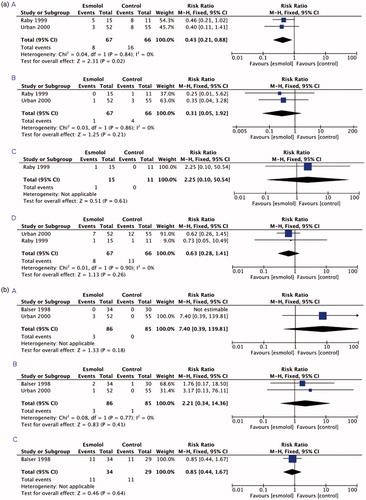
Table 2. Summary of the main results.
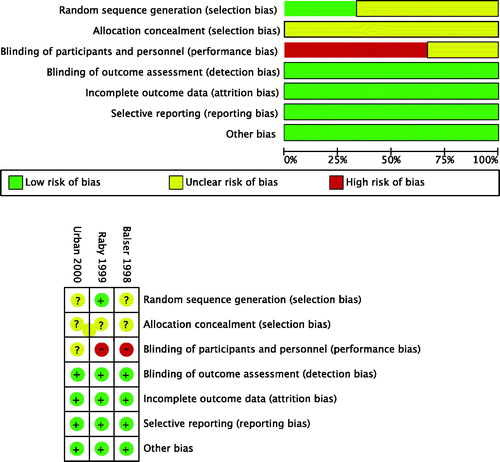
Figure 3. Summary of the risk of bias of the selected studies.
Supplemental material