Figures & data
Table 1. Clinical and demographic parameters of the study population.
Table 2. Genotypic and allelic frequencies in 315 renal transplant recipients.
Table 3. Crude analyses for the association between polymorphisms in the LEPR gene with the development of post-transplant diabetes mellitus (PTDM) in renal transplant recipients.
Table 4. Multivariate logistic regression analysis for the risk of post-transplant diabetes mellitus in renal transplant recipients.
Figure 1. Distribution of the age of the recipient across four different population groups according to post-transplant diabetes mellitus (PTDM) and 223Arg status. **p = .002; ***p = .0004; NS: non-significant. Note: Analyses of differences between the first and third groups, and between the second and fourth groups produced non-significant results.
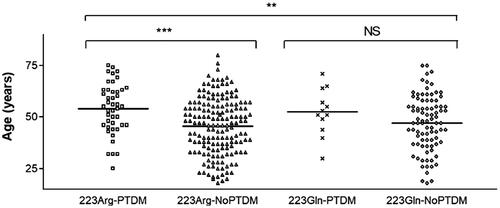
Figure 2. Body mass index (BMI) at transplant and increment of BMI during the first year after transplant, in renal transplant recipients with and without post-transplant diabetes mellitus (PTDM). *p < .00001.
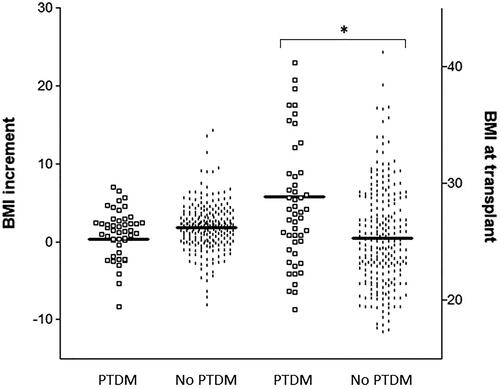
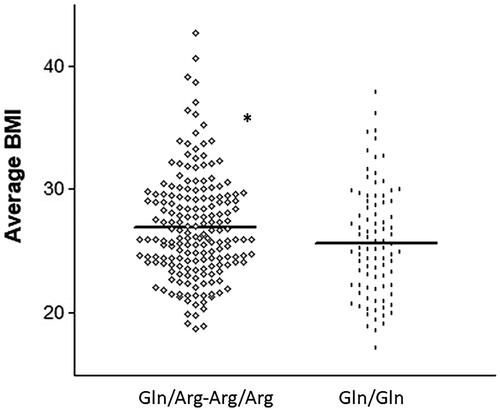
Figure 3. Average body mass index (BMI) in the first year after transplant for carriers and non-carriers of the 223Arg variant. *p < .05.